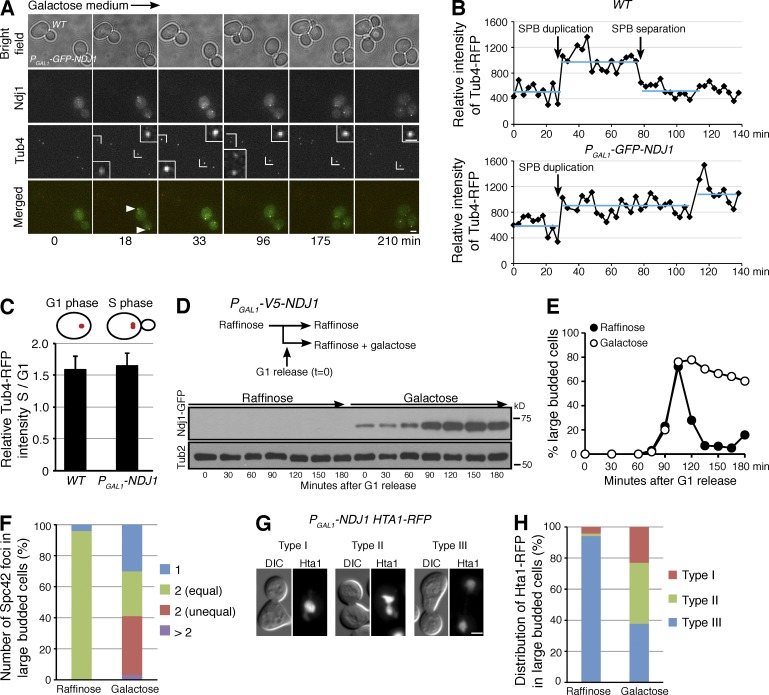
Figure 5.
Ectopic expression of NDJ1 in vegetative yeast cells. (A and B) PGAL1-NDJ1 produces Ndj1 in vegetative yeast cells. Time-lapse (3-min interval) microscopy shows Ndj1 and Tub4 localization. WT (HY3799) and PGAL1-NDJ1 (HY4128) cells were mixed and incubated in the same flask with 3% galactose. Two cells, one from WT, the other from PGAL1-NDJ1, were scoped from the same viewing field over time. Note that Ndj1-GFP (green) is enriched at the SPB (Tub4-RFP, red; arrows). Time in minutes is arbitrarily defined, and representative images are shown. Insets show 4× magnification of the Tub4-RFP signal. Fluorescence intensity of Tub4-RFP in the insets was determined and plotted in B. The cells shown are from a representative time-lapse experiment, n > 15. Bar, 2 µm. (C) The ratio of Tub4-RFP intensity from G1 phase (no bud) cells to those from S phase (small-budded) cells. Error bars indicate standard deviation. n = 10. (D) Protein level of Ndj1 in PGAL1-NDJ1 cells. Yeast cells grown in the raffinose medium were arrested at G1 with alpha factor; addition of 3% galactose induced the expression of PGAL1-NDJ1. (E and F) Cell aliquots were withdrawn at the indicated times upon removal of the alpha factor and prepared for budding index (E) and SPB separation (F). Spc42 was tagged with RFP and used as an SPB marker. The data shown are from a representative experiment out of four repeats. (G and H) Distribution of Hta1-RFP in PGAL1-NDJ1 cells (HY4249-A). Three categories were observed: type I, one Hta1-RFP mass; type II, separated Hta1-RFP masses with a bridge; type III, two separated Hta1-RFP masses. The data shown are from a representative experiment out of three repeats. Bars, 2 µm.

