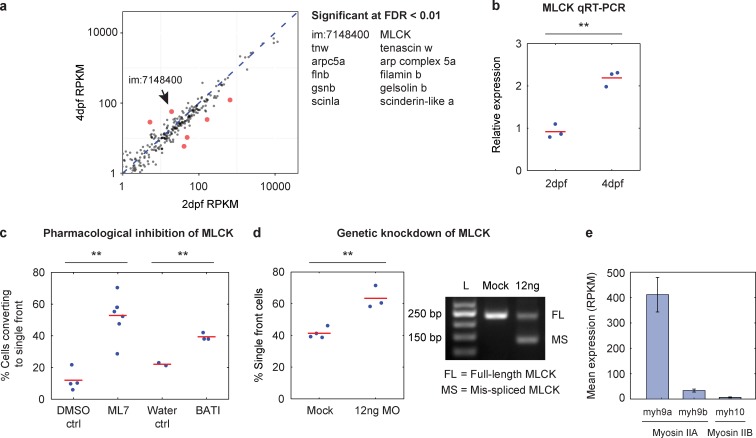
Figure 4.
Increased MLCK expression in 4-dpf cells is largely responsible for the multiple-front phenotype. (a) Expression of cytoskeleton-related genes as measured in 2-dpf and 4-dpf cells by RNAseq. Each dot represents the mean expression level of one cytoskeleton-related gene over three biological replicates for each developmental stage. Genes highlighted in red were differentially expressed at a false discovery rate (FDR) <0.01. The broken line indicates y = x. (b) Expression of im:7148400 measured in 2-dpf and 4-dpf cells by qPCR and shown normalized to the expression level in 2-dpf cells. Points represent biological replicate measurements; red bars represent means. (c) Conversion of 4-dpf multiple-front cells to a single-front phenotype after treatment with MLCK inhibitors. 4-dpf multiple-front cells were treated with DMSO control, 25 µM ML7, water control, or 20 µM BATI. Each dot represents an independent experiment. At least 180 cells were scored in total for each condition. (d) The effect of MLCK morpholino on 4-dpf cell behavior. Left, percentage of single-front cells in the 4-dpf keratocyte population. Each dot represents a single coverslip. At least 300 cells were scored for each condition. Data shown are from a single batch of injections and are representative of four injection batches. Right, morpholino-induced splicing changes as measured by PCR in individual 4-dpf embryos. L indicates a 50-bp ladder. (e) Expression of myosin isoforms as measured by RNAseq, plotted as reads per kilobase per million mapped (RPKM). Data shown were pooled from three replicates each of the 2-dpf and 4-dpf cells. Error bars indicate standard error of the mean. Myosin IIC was not detectable. **, P < 0.01 as measured by two-sample t test.

