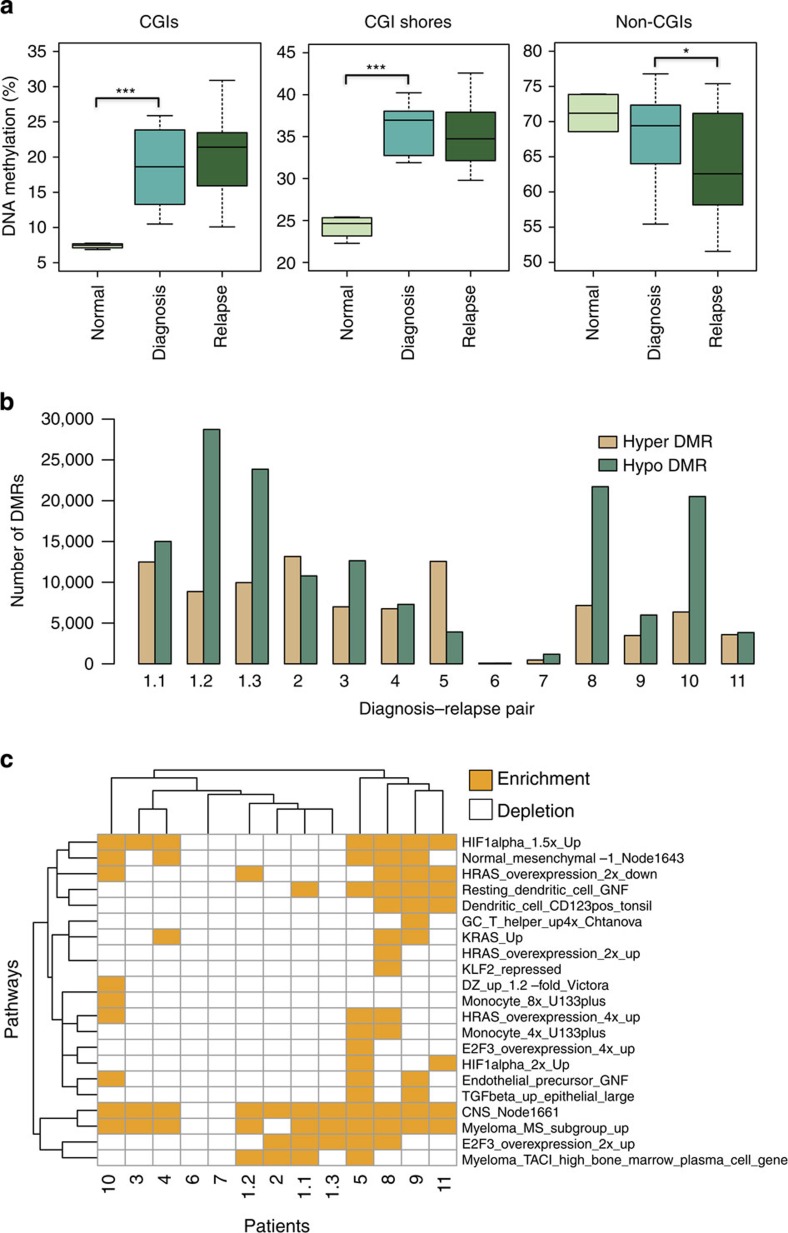
Figure 1. DNA methylation landscape changes in DLBCL patients.
(a) Percentage of DNA methylation in CGIs, CGI shores and non-CGIs of normal B cells (n=4) and diagnosis–relapse DLBCL sample pairs (n=13). For each CpG, we collected the number of methylated reads and the number of total reads. The DNA methylation for different genomic regions for each sample was calculated by the percentage of methylated reads out of total reads from all the CpGs inside corresponding regions. ***P<1e−5, *P<0.05 (t-test, normal versus diagnosis; paired t-test, diagnosis versus relapse). The median, upper and lower quartiles are shown. Whiskers represent upper quartile+1.5 IQR and lower quartile−1.5 IQR. (b) Numbers of hypermethylated or hypomethylated DMRs of individual DLBCL patients, between diagnosis and relapse. Patient 1 had 3 sites of relapse and consequently 3 diagnosis–relapse pairs were analysed (the same diagnosis sample was used for all comparisons). Out of 13, 11 pairs show more hypomethylated regions than hypermethylated regions. (c) Pathways overexpressed with hypermethylated genes (promoters overlapped with hypermethylation DMRs) of individual patients were illustrated here. Each row represents a single pathway and each column represents a patient pair. The enrichment of the pathways was determined in a patient-by-patient manner (n=1, P<0.005, randomization-based non-parametric testing). GO analyses were performed with iPAGE20. Pathways from the lymphoid gene signature database for Staudt Lab21 were used here. The background included around 24,000 genes from Refseq. IQR, interquartile range.

