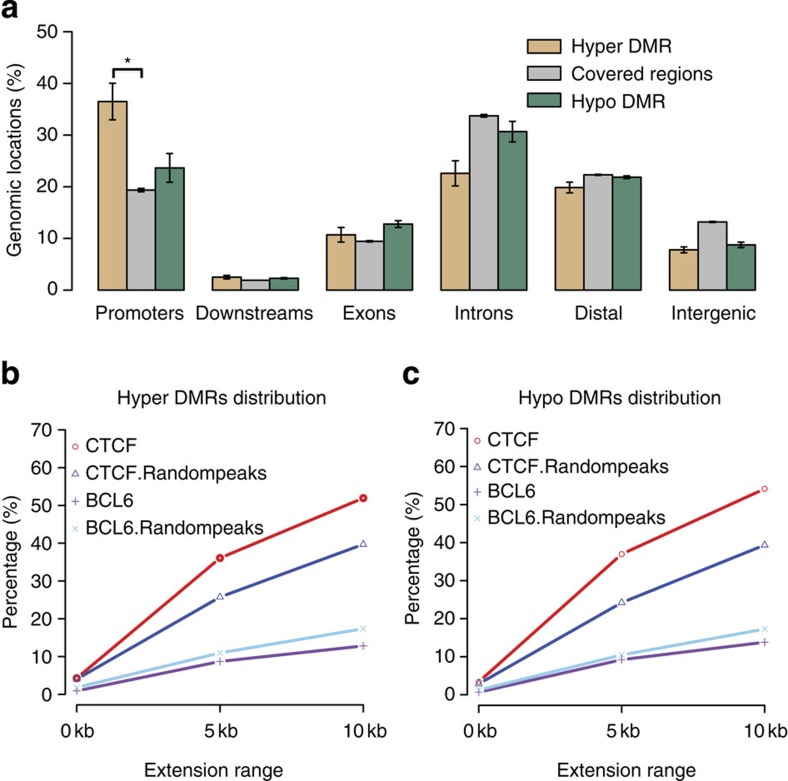
Figure 2. Consistently differentially methylated regulatory elements between diagnosis and relapsed patients.
(a) Percentage of hypermethylated regions, ERRBS-covered regions and hypomethylated regions within indicated genomic locations. *P<2.2e−16 (binomial test). Standard errors are shown as error bars. (b) Percentage of hypermethylated DMRs occurring within CTCF peaks, CTCF random peaks, BCL6 peaks and BCL6 random peaks. (c) Percentage of hypomethylated DMRs occurring within CTCF peaks, CTCF random peaks, BCL6 peaks and BCL6 random peaks. In b,c, random peaks were generated randomly with the same genomic distribution as the true binding sites22.

