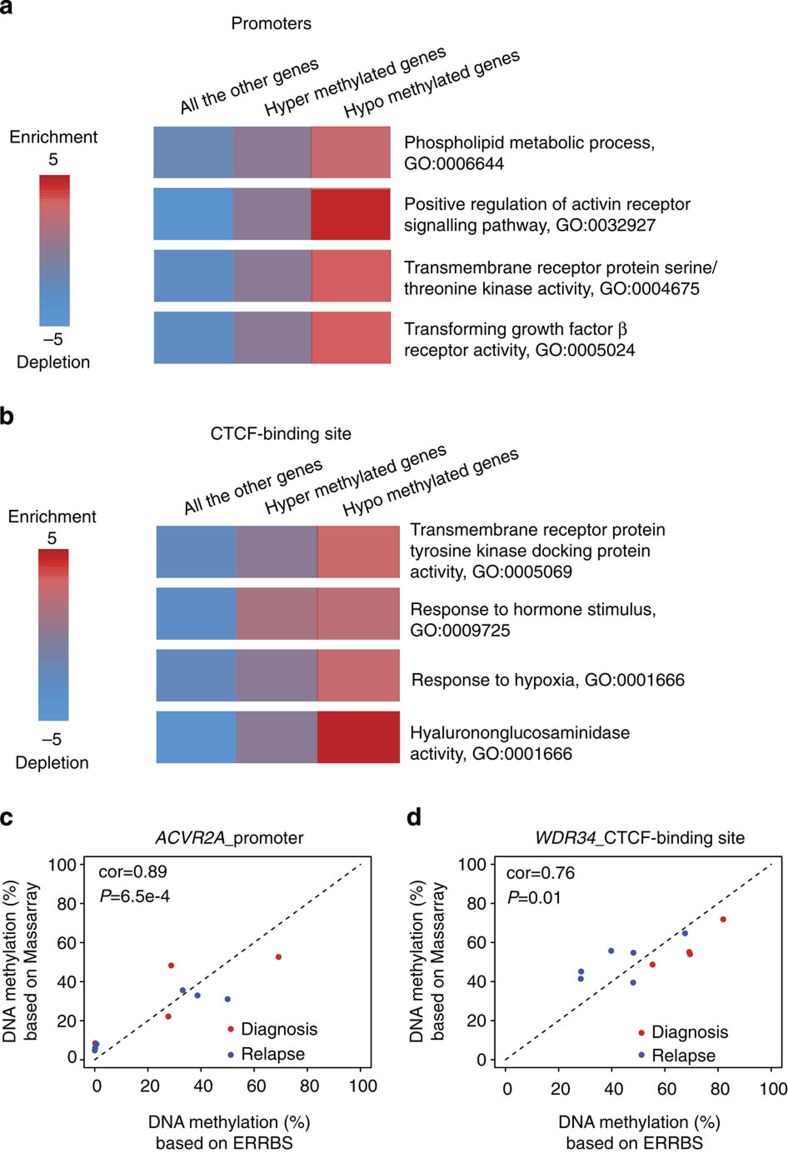
Figure 3. Methylation signature at relapse involves key genes and pathways.
(a) Pathways over-represented within consistently differentially methylated genes (based on promoters) across all the patients. P values were 0.0030, 0.0001, 0.0005 and 0.0009 from top to bottom (hypergeometric tests). (b) Pathways over-represented within genes in the neighbourhood of hypomethylation or hypermethylation CTCF peaks (≤10 kb). P values were 0.0036, 0.0024, 0.0029 and 0.0000 from top to bottom (hypergeometric tests). In a,b, GO analyses were performed with iPAGE20. Known pathways in the GO46 were used here. The background included around 24,000 genes from Refseq gene annotation. The red colour indicates (in log10) the over-represented P values and the blue shows under-representation. (c) Correlations of average methylation level between ERRBS and MassArray in ACVR2A promoter. (d) Correlations of average methylation level between ERRBS and MassArray in CTCF-binding site near WDR34. In c,d, red and blue dots represent diagnosis and relapsed samples, respectively. P values were derived from correlation test (cor.test() function in R).

