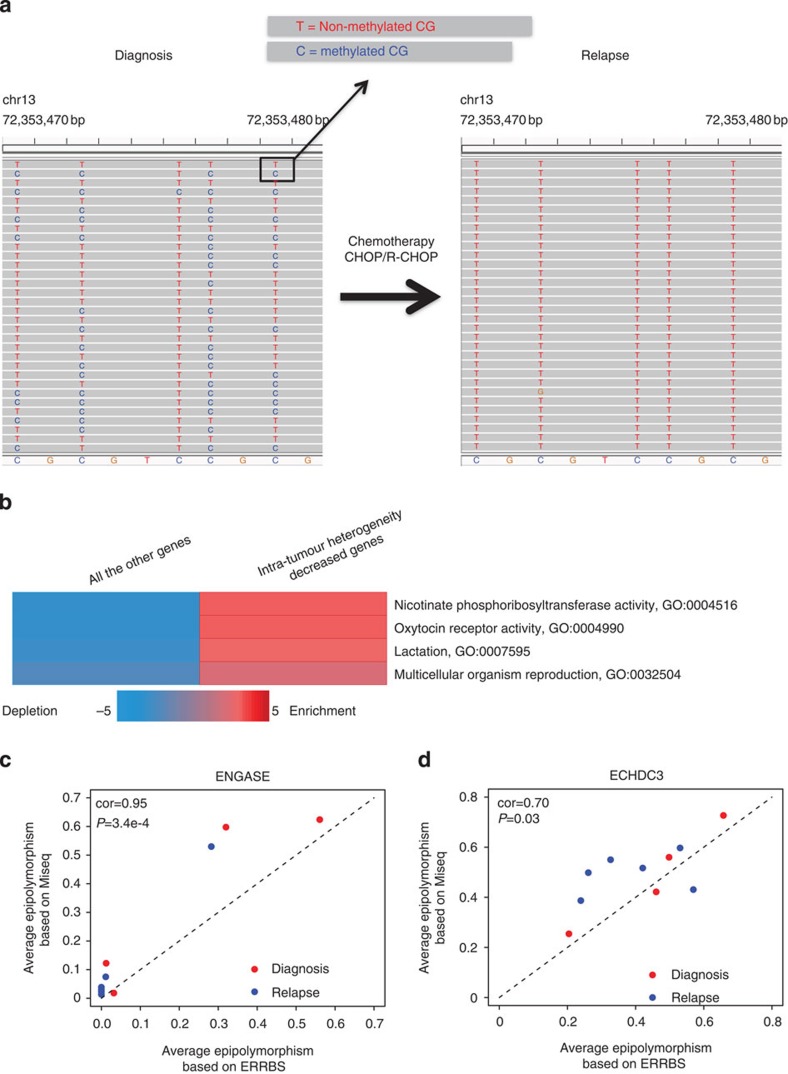
Figure 5. Convergence of methylation patterns at relapse involves key genes and pathways.
(a) A locus displayed decreased intra-tumour MH from diagnosis to relapse. T and C at CpG site indicate unmethylated and methylated CpG separately. The tumour cell population displayed diverse DNA methylation patterns at diagnosis and the diversity is complete loss at relapse. (b) Pathways over-represented with decreased intra-tumour MH genes. P values were 0.0005, 0.0005, 0.0015 and 0.0048 from top to bottom (hypergeometric tests). GO analyses were performed with iPAGE20. Known pathways in the GO46 were used here. The background included around 24,000 genes from Refseq gene annotation. The red colour indicates (in log10) the over-represented P values and the blue shows under-representation. (c) Correlations between the average intra-tumour MH derived from ERRBS or Bisulfite-PCR-MiSeq in ENGASE promoters. (d) Correlations between the average intra-tumour MH derived from ERRBS or Bisulfite-PCR-MiSeq in ECHDC3 promoters. In c,d, MiSeq based intra-tumour MH was calculated using the same analytical approach as the one used for ERRBS. Red and blue dots represent diagnosis and relapsed samples, respectively. P values were derived from correlation test (cor.test() function in R).

