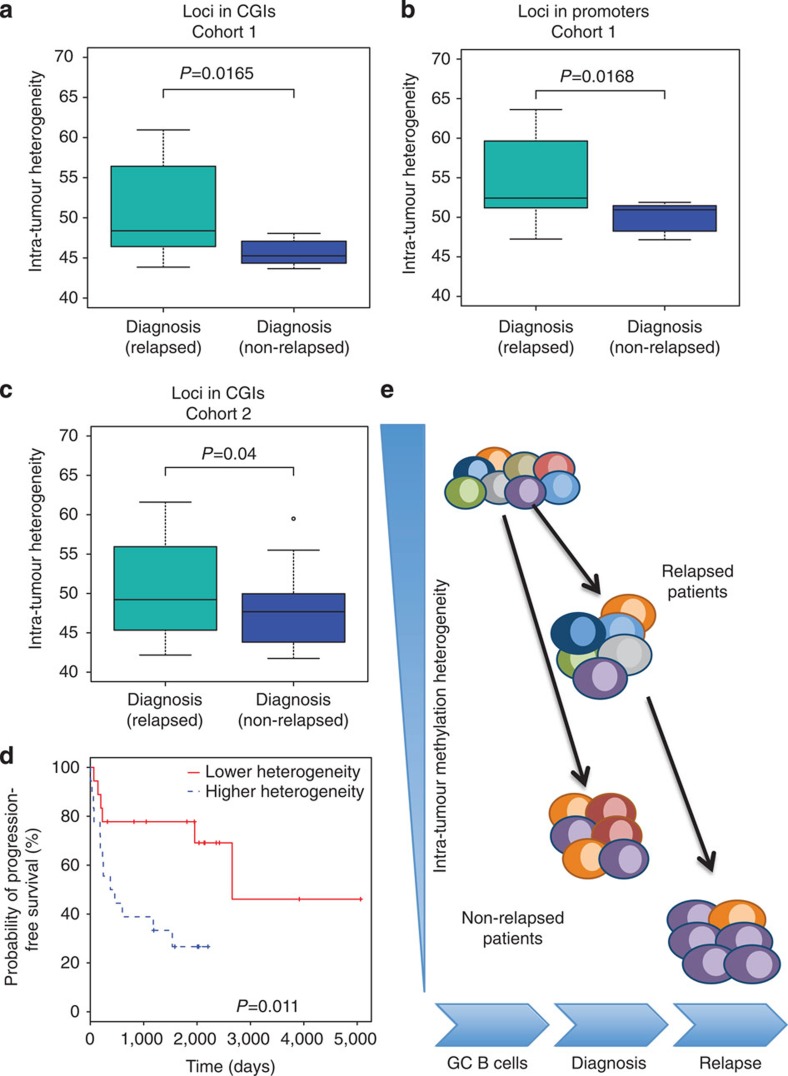
Figure 6. Intra-tumour MH at diagnosis is predictive of relapse occurrence.
(a) Non-relapsed patients (n=7) had lower intra-tumour MH compared with relapsed ones (n=11; Cohort 1). All the loci analysed were located in CGIs. (b) Non-relapsed patients (n=7) had lower intra-tumour MH compared with relapsed ones (n=11; Cohort 1). All the loci located in promoters. (c) Patients who had not relapsed in 5 years after diagnosis (n=19) had lower intra-tumour MH compared with relapsed one (n=29; Cohort 2). All the loci analysed here were located in CGIs. In a–c, P values were obtained using t-test. The median, upper and lower quartiles are shown. Whiskers represent upper quartile+1.5 IQR and lower quartile−1.5 IQR. (d) Kaplan–Meier plot comparing the progression-free survival between DLBCL patients with higher (30%, n=18) versus lower (30%, n=18) intra-tumour MH (Cohort 2). P value was obtained using log-rank test. (e) Schematic of our epigenetic evolution model. Different colours represent different cell subgroups with different DNA methylation patterns. Intra-tumour MH decreased with tumour evolution. Non-relapse patients displayed lower intra-tumour MH compared with relapse ones.

