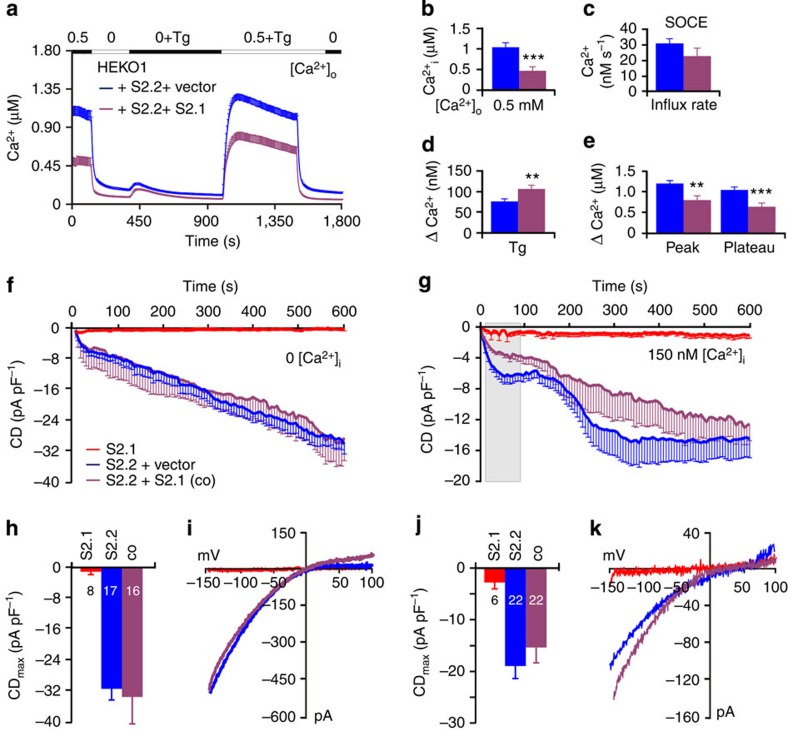
Figure 6. STIM2.1 opposes STIM2.2 function.
(a) Traces showing average changes in intracellular Ca2+ concentration [Ca2+]i over time in response to perfusion of different [Ca2+]o indicated in the upper bar in HEKO1 cells co-transfected with 0.5 μg CFP-STIM2.2 together with YFP-control vector (blue) or 1 μg YFP-STIM2.1 (purple). (b–e) Quantification of changes in [Ca2+]i measured in a from 66–69 cells of 6 experiments. (f) Average traces showing whole-cell current density (CD) over time extracted at −130 mV in HEKO1 cells co-transfected like in a or with 1 μg YFP-STIM2.1 (red, same trace as Fig. 4f) with internal solution clamping [Ca2+] to 0. (g) Average traces showing whole-cell CD over time measured from cells transfected like in f with an internal solution clamping [Ca2+] to 150 nM. Grey box denotes time points between 12 and 90 s after break-in. (h,j) Average maximum CD recorded from cells measured in f and g, respectively. (i,k) Current–voltage (I–V) relationship of representative cells recorded at maximal current in f and g, respectively. **P<0.01, ***P<0.001, Student's T-test. Data obtained are presented as mean±s.e.m.

