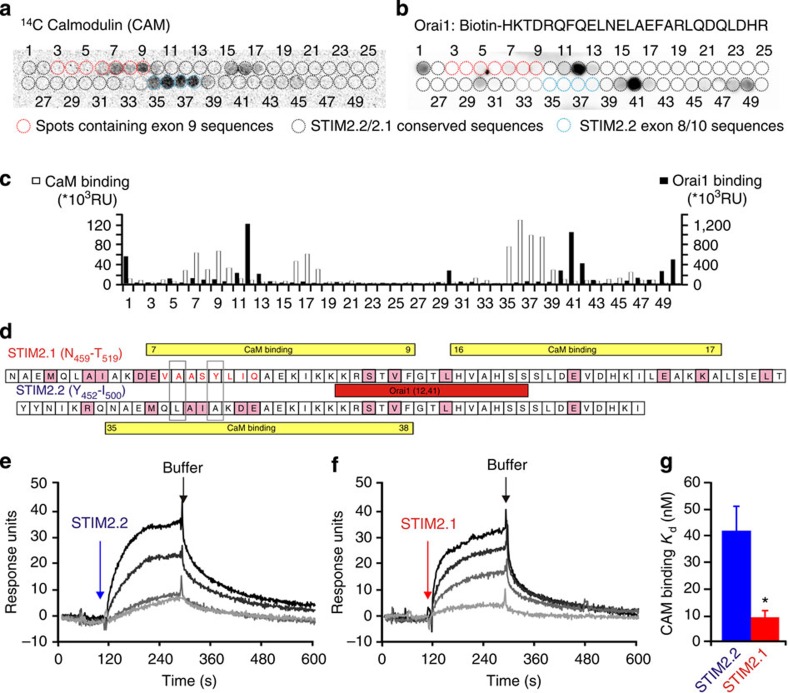
Figure 8. Characterization of Orai1 and Calmodulin-binding properties of STIM2.1 and STIM2.2.
(a) 14C-labelled calmodulin (CaM) binding to STIM2 peptide arrays. (b) Biotinylated Orai1 C-term peptide binding to identical STIM2 peptide array as in a. Spots encircled with a red dotted line represent peptides encoding exon 9 sequences, blue dotted line represent peptides encoding the sequence flanking exon 9 (exon 8/10 transition unique in STIM2.2) and black circles represent peptides encoding conserved sequence in both splice variants. (c) Quantification of bound Orai1 peptide (black bars) or CaM (white bars) to the different peptide spots. (d) Schematic representation of partial sequences of STIM2.1 (upper sequence) or STIM2.2 (lower sequence) encoded by the spotted peptides, showing the domains binding to CaM in STIM2.1 (yellow, encoded by peptides 7–9 and 16–17) and in STIM2.2 (yellow, encoded by peptides 35–38) and the identical Orai1-binding domain (red encoded by peptide 12 for STIM2.1 and peptide 41 for STIM2.2). (e,f) Surface plasmon resonance (SPR) analysis of the binding affinity of calmodulin with representative binding curve sensorgrams showing real association and dissociation of purified CAD domains of STIM2.2 (red-filled boxes denote differences to STIM1). (e) or STIM2.1 (f) with immobilized CaM. (g) Average Kd values for CaM binding of STIM2.2 (blue) or STIM2.1 (red) obtained from five independent experiments using CAD concentrations ranging from 7.5 to 750 nM, *P<0.05, Student's T-test. Data obtained are presented as mean±s.e.m.

