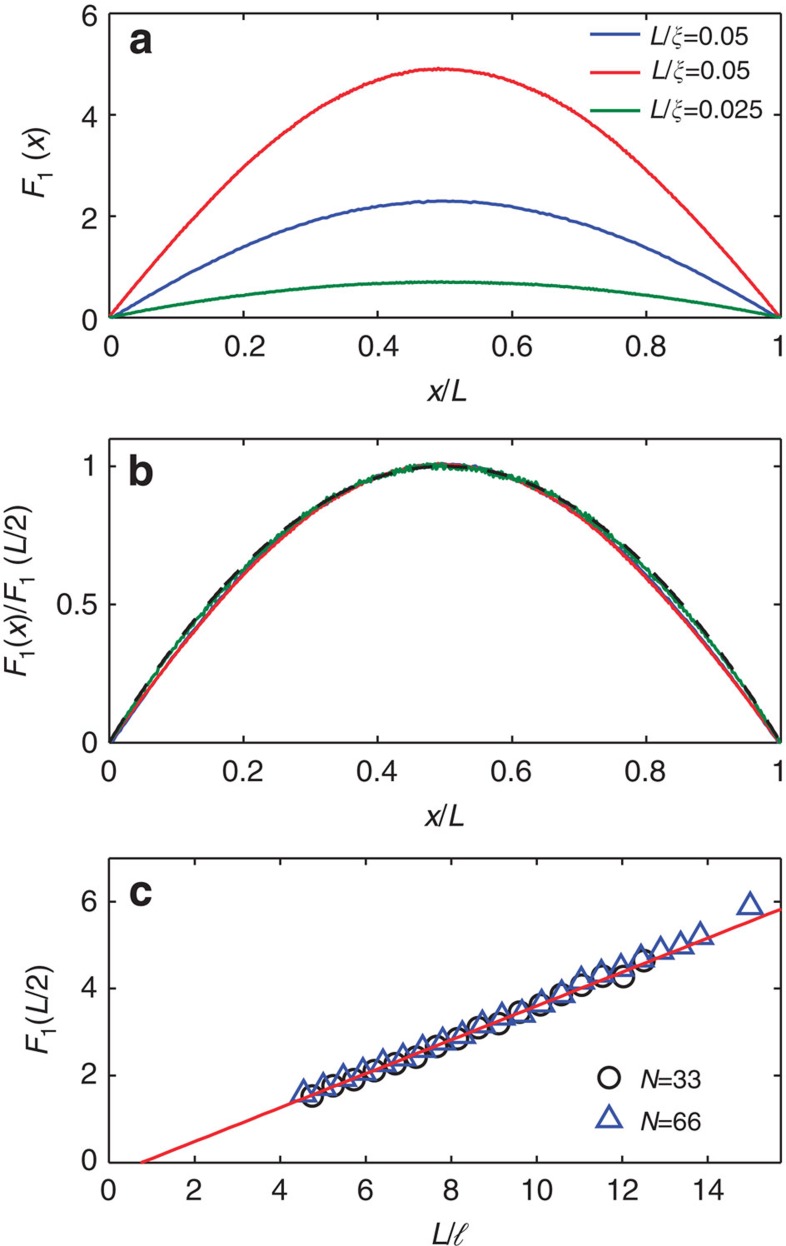
Figure 2. Profiles for perfectly transmitting eigenchannels.
(a) Ensemble averages of the perfectly transmitting channel F1(x) for the two diffusive samples of Fig. 1 with L/ξ=0.05 and a sample with L/ξ=0.025. (b) F1(x) normalized by its peak value F1(L/2). (c) Scaling of F1(L/2) with L/ℓ for samples with N=66 (blue triangles) and N=33 (black circles). The linear fit to the results of simulations with a slope of π/8=0.39 given by Y1(L/2,L/2) gives  plotted as the red curve.

