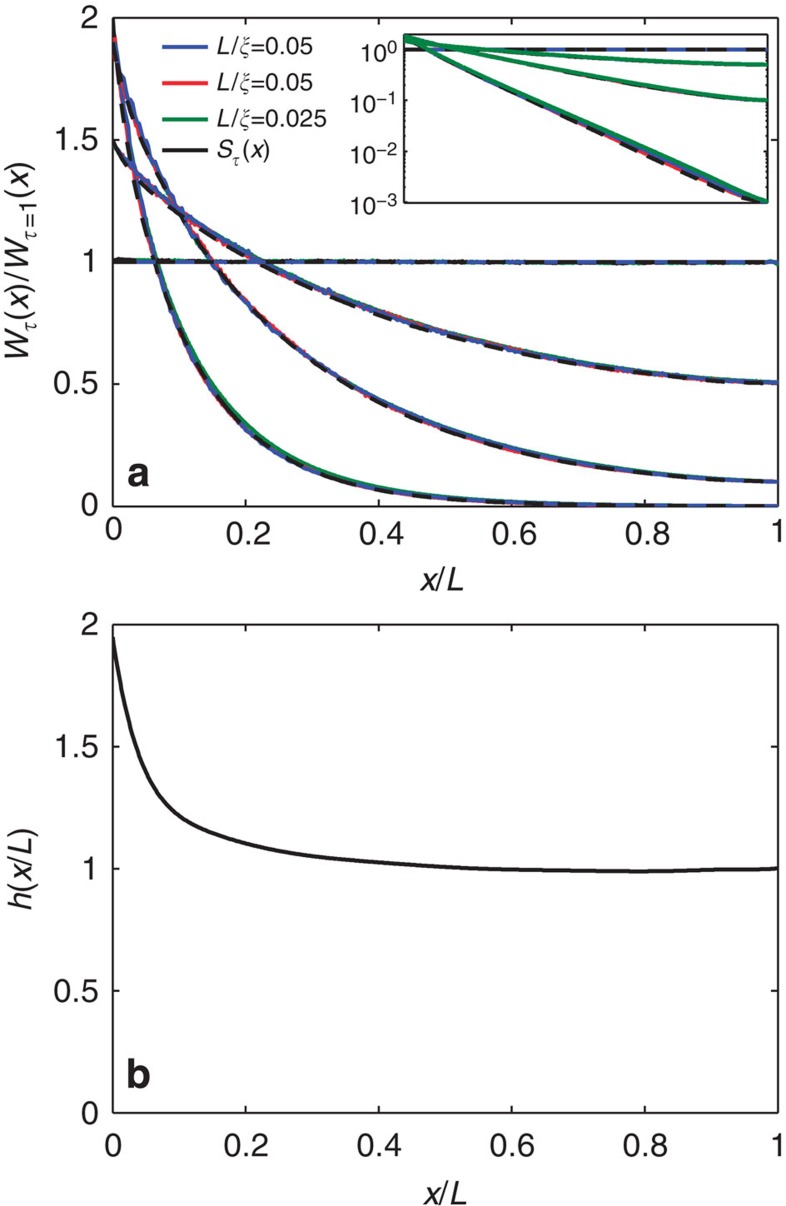
Figure 4. Factorization of energy density profiles.
(a) Wτ(x)/Wτ=1(x) for the three ensembles of samples of Fig. 1 (blue and red curves) and a sample with L/ξ=0.025 (green curve). The black dashed curves are given by equation (5) with h(x/L) shown in b. Curves of simulations of Wτ(x)/Wτ=1(x) for the same values of τ in different samples and for Sτ(x) given by equation (5) overlap. (b) h(x/L) determined from equation (5).

