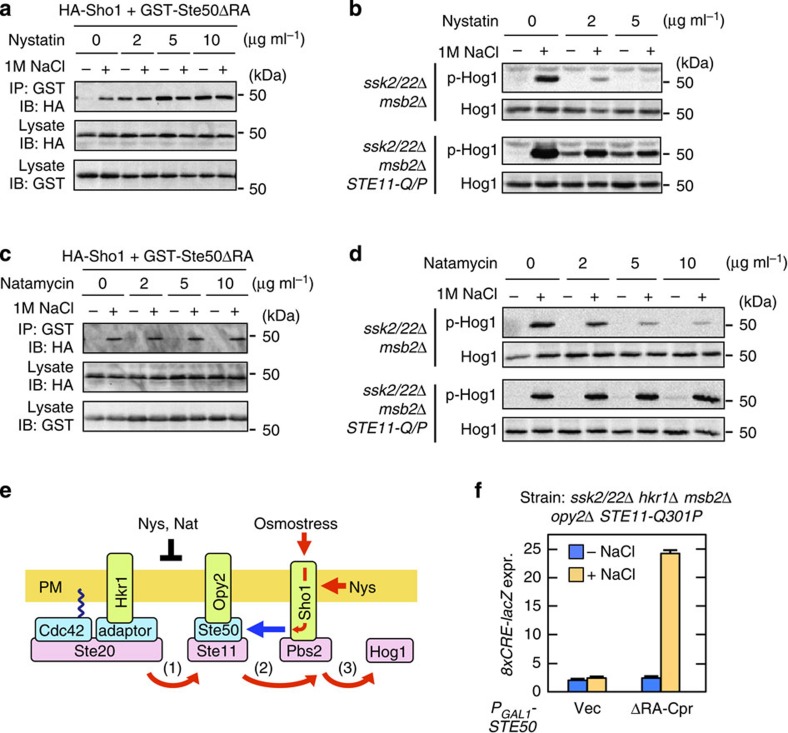
Figure 4. Membrane permeabilization activates the Sho1 osmosensor.
(a) Ste50–Sho1-binding assays. The procedure was the same as in Fig. 2d, except that the cells were treated with the indicated concentrations of nystatin for 5 min immediately before 1 M NaCl (final concentration) was added. (b) Hog1 phosphorylation assays. The yeast strains KT034 and KT033, of the indicated genotypes, were treated with the indicated concentration of nystatin for 5 min, and were then stimulated with (+) or without (−) 1 M NaCl for a further 5 min. Hog1 phosphorylation was determined by immunoblotting using an anti-phospho-p38 antibody. (c,d) The same as in a and b, respectively, except that natamycin was used in place of nystatin. (e) Model of the induced Ste50–Sho1 interaction. Red arrows, positive flow of the signal; black bar, inhibition of signalling; blue arrow, inducible protein binding; Nat, Natamycin; Nys, Nystatin. (f) Hog1-specific reporter assays of KY594-1 cells transformed with an expression plasmid for the Ste50ΔRA-Cpr construct. Ste50ΔRA-Cpr was expressed from the GAL1 promoter for 2 h. Expression of the 8xCRE-lacZ reporter gene was determined as in Fig. 3a. Error bars indicate s.d. (n=3).

