
Figure 5.
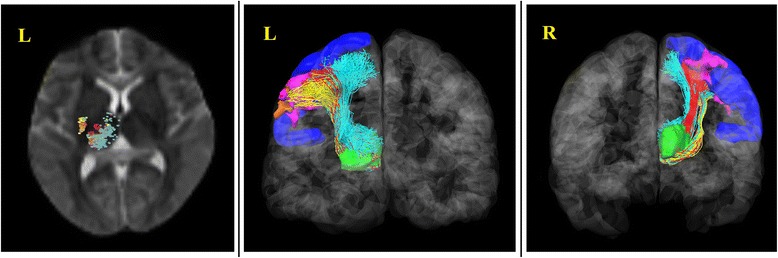
DTI tractography between the beginning region of interest to ROI1, ROI 2 and RIO3.The thalamus was selected as the beginning region of interest. ROI1 (pink): brain regions that showed decreased functional connectivity in MWoA patients compared with HC before treatment. ROI2 (orange): brain regions that showed increased FC in MWoA patients after treatment compared with that before. ROI3 (blue): the left precentral gyrus. The red, yellow and cyan fibers indicated fibers from the left thalamus to ROI1, ROI2 and RIO3 respectively.