
Figure 4.
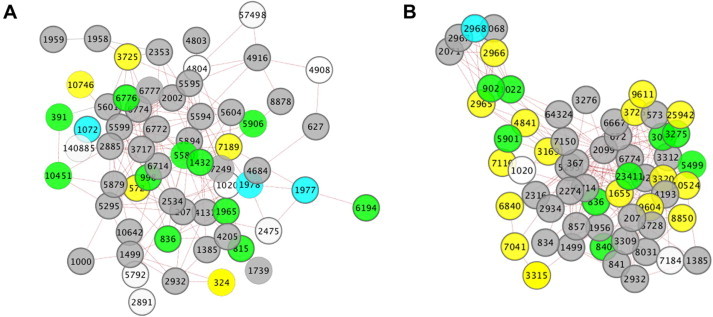
Two sub-networks identified within the SMA co-expression network
A. The BDNF signaling pathway. B. The androgen receptor pathway. The Entrez Gene IDs were used for the node label as required by COXPRESdb for input. The node color scale is inherited from COXPRESdb. Larger nodes are the query genes and smaller gray nodes are additional nodes with one or more edges to at least one query node. Solid lines and red dotted lines indicate gene co-expression and protein–protein interactions from the Human Protein Reference Database (HPRD) and IntAct databases, respectively.