
Figure 3.
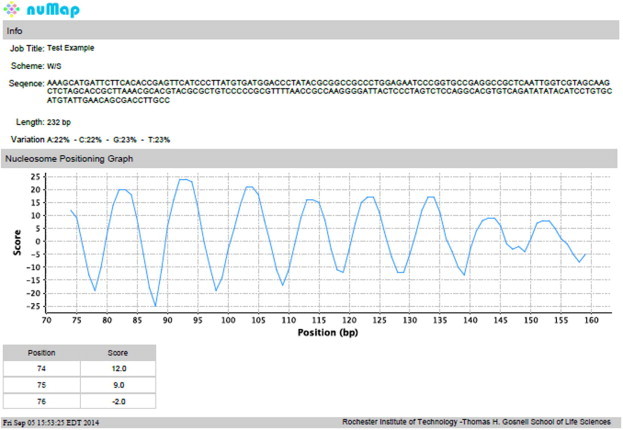
Example of nuMap output in PDF format
A sample out of the nuMap server is shown. The Information Panel is shown on the top, containing job-related information such as sequence name and user-selected options including prediction scheme, sequence, its length and composition. A profile of the nucleosome positioning score of the ‘601’ sequence, in this case, predicted by the W/S scheme is shown underneath. The physical meaning of the score is straightforward – the lower the DNA deformation energy for particular sequence motifs placed at the sites of DNA distortion, the higher the score. The score is calculated for each 147-bp window and is assigned to the center position of a given window. The actual score at each position is given in a tabular form.