Figure 5.

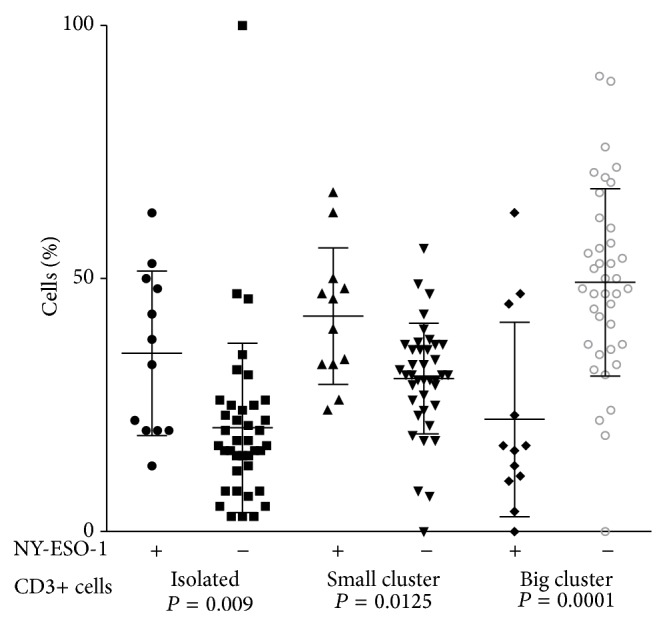
Arrangement of CD3+ cells in TIL of NY-ESO-1 positive and negative primary cutaneous melanoma. Each geometric figure represents the percentage of cells in one patient. The horizontal bars represent the mean value.

Arrangement of CD3+ cells in TIL of NY-ESO-1 positive and negative primary cutaneous melanoma. Each geometric figure represents the percentage of cells in one patient. The horizontal bars represent the mean value.