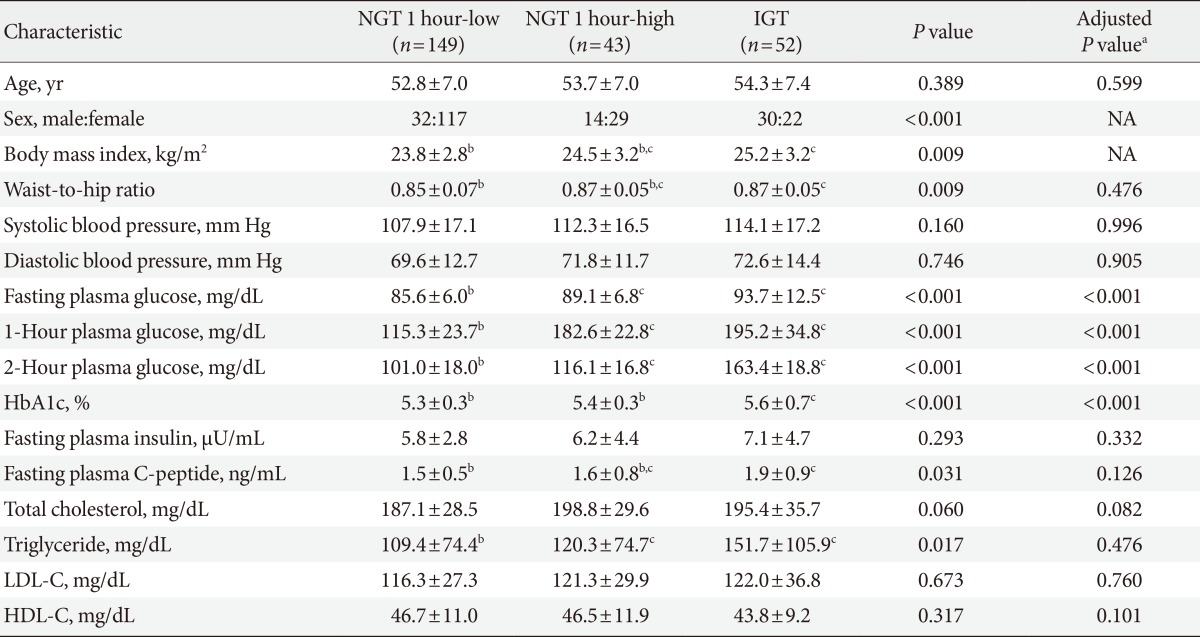
Table 1. Clinical and biochemical characteristics of study subjects.

Values are presented as mean±standard deviation. P values were calculated after normalizing log transformation using one-way analysis of variance except for sex, which was calculated by the chi-square test.
NGT, normal glucose tolerance; IGT, impaired glucose tolerance; NA, not applicable; HbA1c, hemoglobin A1c; LDL-C, low density lipoprotein cholesterol; HDL-C, high density lipoprotein cholesterol.
aSex and body mass index (BMI) adjusted P values were calculated after normalizing log transformation using analysis of covariance with age and BMI as covariates, b,cThe data with different superscript letters are significantly different (P<0.05) according to the Games-Howell post hoc test.
