
Table 2. Correlations between changes of the continuous glucose monitoring system measures and glycemic assays.
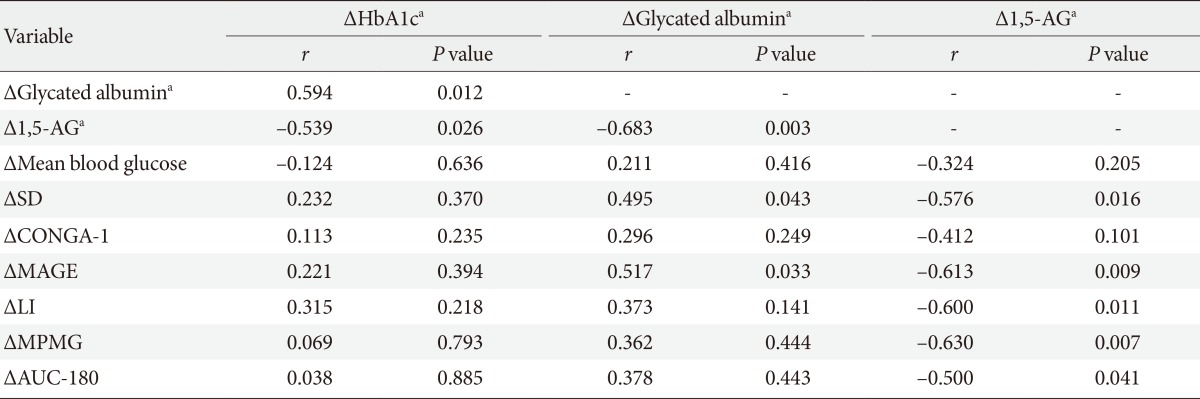
Δ The differences of the variables for the 2-week interval.
HbA1c, hemoglobin A1c; 1,5-AG, 1,5-anhydroglucitol; SD, standard deviation; CONGA-1, continuous overlapping net glycemic action with 1 hour time intervals; MAGE, mean amplitude of glucose excursion; LI, lability index; MPMG, mean post-meal maximum glucose; AUC-180, area under the curve for glucose above 180 mg/dL.
aLog transformed.