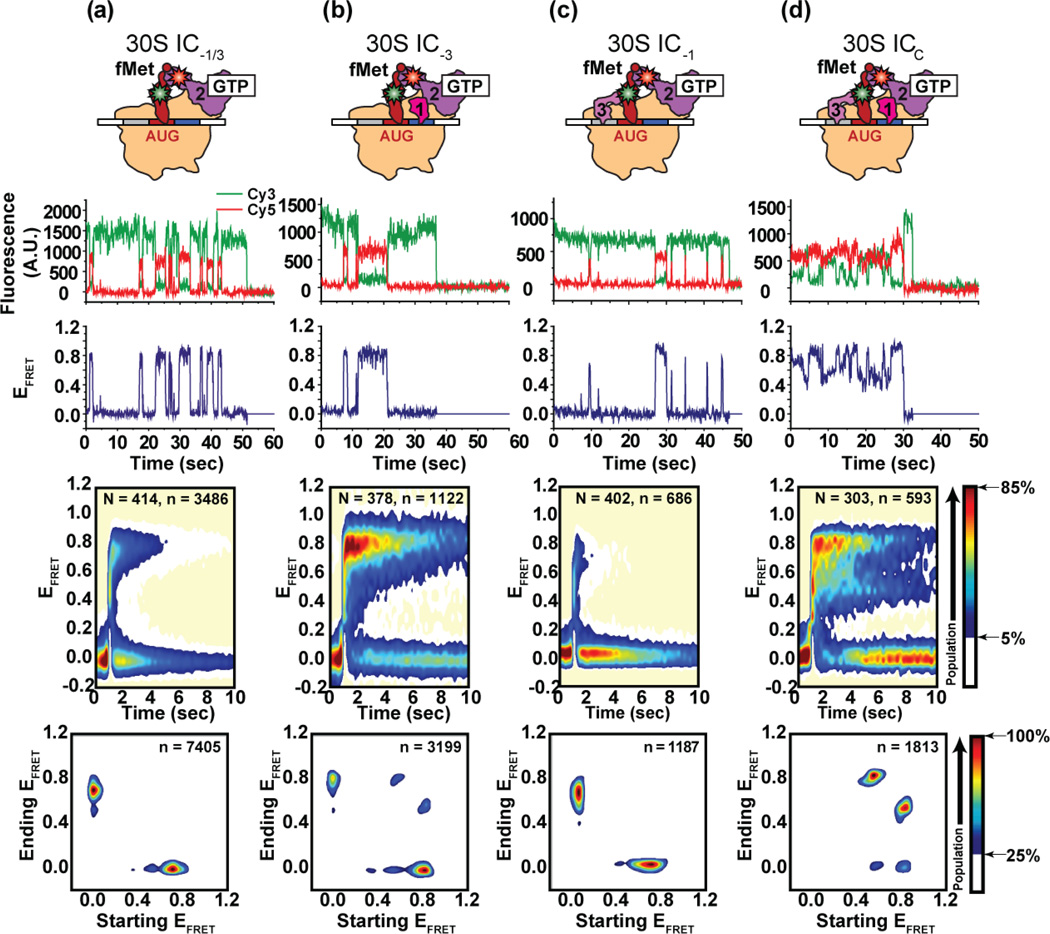
Figure 2.
The effect of IF1 and IF3 on the stability of IF2 and the conformational dynamics of the IF2•tRNA sub-complex. Cartoon representations of each of the 30S ICs investigated are shown along the top row. In each case, the IF2-bound state of the 30S IC is depicted. Representative Cy3 (green) and Cy5 (red) emission intensities versus time trajectories are shown in the second row, and the corresponding EFRETversus time trajectories are shown in the third row. Binding of IF2 results in an increase Cy5 intensity and an anti-correlated decrease in Cy3 intensity due to FRET. Accordingly, the IF2-bound state of the 30S IC corresponds to the non-zero portions of the EFRETversus time trajectories. Post-synchronized surface contour plots of the time evolution of population FRET are shown in the fourth row. Surface contour plots were generated as described in the Results and in Supplementary Fig. 5d. “N” indicates the total number of EFRETversus time trajectories for each 30S IC and “n” indicates the total number of individual IF2 binding events. The surface contours were plotted from tan (lowest population plotted) to red (highest population plotted) as indicated in the population color bar. Transition density plots (TDPs) are shown in the fifth row. TDPs were generated by plotting the “Starting EFRET” versus the “Ending EFRET” for each transition identified in the idealized EFRET trajectories as a surface contour plot of a two-dimensional EFRET histogram as described in Supplementary Fig. 5e. “n” indicates the total number of transitions that were used to generate each TDP. Surface contours are plotted from tan (lowest population plotted) to red (highest population plotted) as indicated in the population color bar. (a) 30S IC−1/3, (b) 30S IC−3, (c) 30S IC−1, and (d) 30S ICC.

