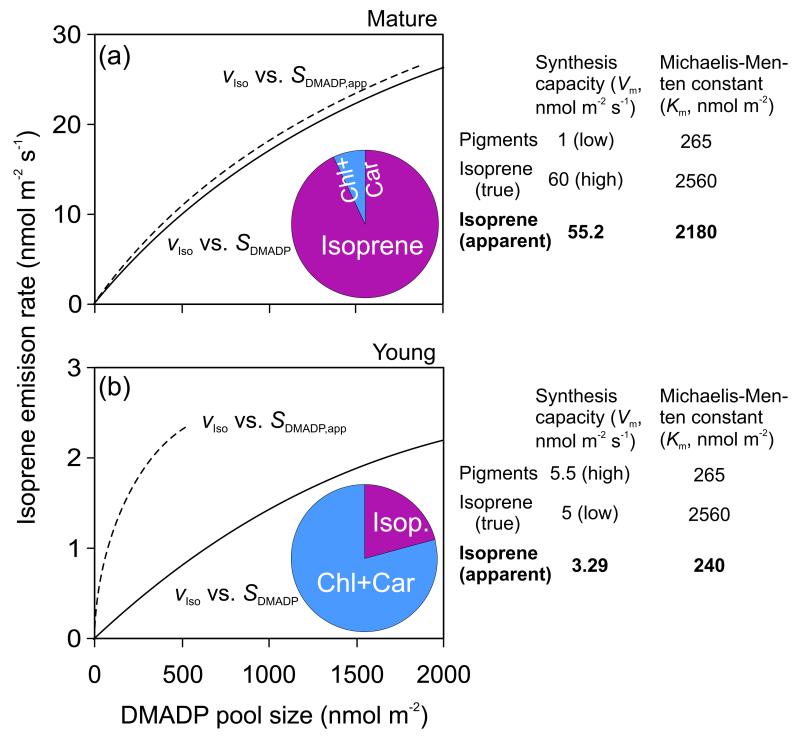
Figure 4.
Simulation of isoprene emission rate (νIso) vs. true (SDAMAP, solid line) and apparent DMADP pool size (SDMADP,app, dashed line) pool size relationships during light-dark transients (Supplemental Material S1, Fig. S1.1a for sample relationships) for a mature leaf (a) with a high capacity for isoprene emission and a low capacity for pigment synthesis and for a young leaf (b) with a low capacity for isoprene emission and a high capacity for pigment synthesis. After switching off the light, isoprene emission rate and DMADP pool size start to decrease until the preexisting pool of DMADP is exhausted. When isoprene emission rate is the only process consuming DMADP, integrating isoprene emission to a certain moment of time provides DMADP pool size that is remaining at that moment of time. However, when other processes compete for chloroplastic DMADP, this integration results in an apparent DMADP pool size (SDMADP,app). In both panels, the relationships of νIso vs. SDAMAP were derived by Eq. 3 and 4 using constant Km values for isoprene and pigments based on simultaneous fitting of all data. SDMADP,app was thereafter derived by integrating the values of isoprene emission (Eq. 5), and the apparent Km,iso values derived from νIso vs. SDMADP,app relationships (Hanes-Wolff plots). The pie diagrams show relative contributions of isoprene emission and pigment synthesis to overall consumption of DMADP pool size accumulated before the light-dark transient.

