
Figure 3.
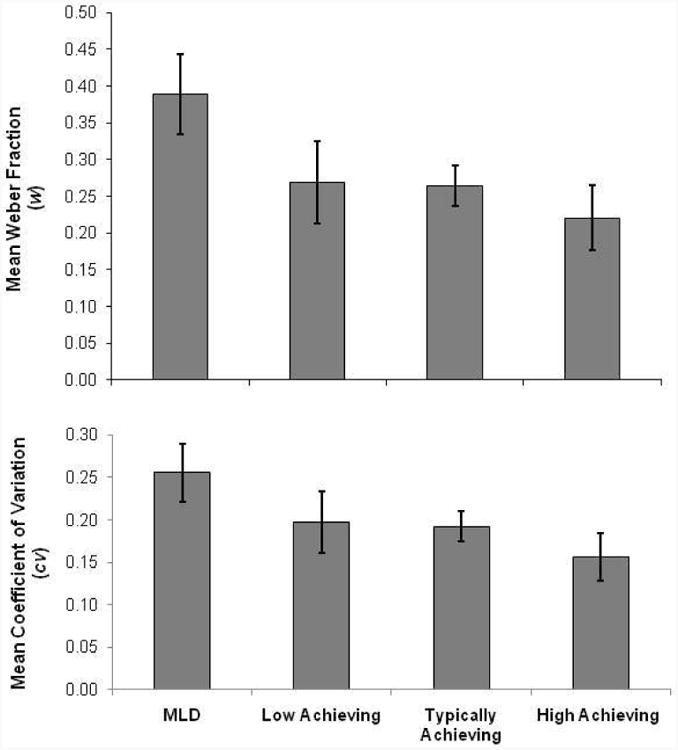
Mean ANS-acuity (w) and mean mapping-precision (cv) scores derived from the Number Discrimination and Identification Tasks, respectively, for each of four levels of Mathematics Achievement Group. Errors bars represent 95% confidence intervals for each group mean. For both w and cv, a lower score represents better performance.