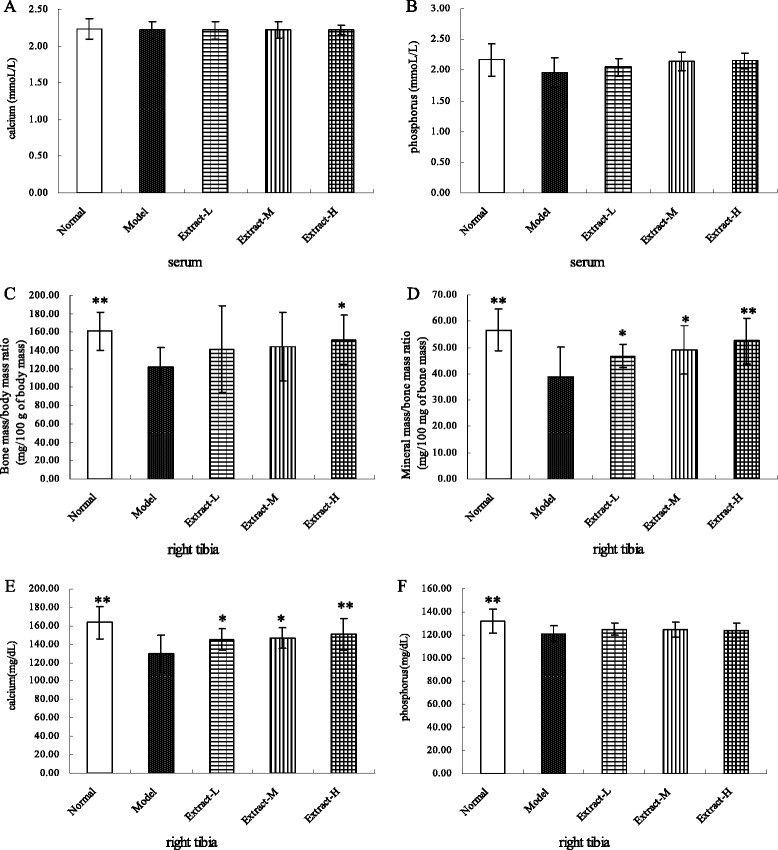
Figure 3.

Effects of the combination with TFE and TIFL on bone mineral contents in osteoporosis rats, including serum calcium (A), serum phosphorus (B), the ratio of bone mass to body mass (C), the ratio of mineral mass to bone mass (D), bone calcium (E) and bone phosphorus (F). Bone mass/body mass ratio, mineral mass/bone mass ratio, bone calcium and bone phosphorus in the osteoporosis model group were significantly lower than those in the normal group. Mean ± SD, n = 10. * P < 0.05 and ** P < 0.01 vs osteoporosis model group.
