Figure 4.

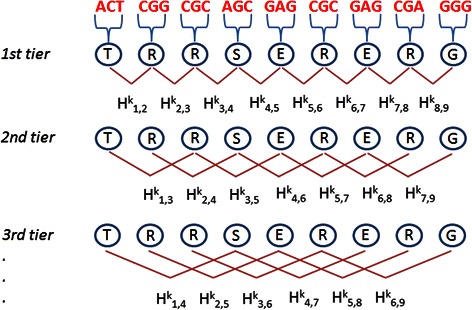
Amphiphilic PseAAC representation. This is a diagram shows how the correlation factors Hk, based on amino acid hydrophobicity (k = 1) and hydrophilicity (k = 2), vary in each tier by coupling residues at different distances.

Amphiphilic PseAAC representation. This is a diagram shows how the correlation factors Hk, based on amino acid hydrophobicity (k = 1) and hydrophilicity (k = 2), vary in each tier by coupling residues at different distances.