
Figure 2.
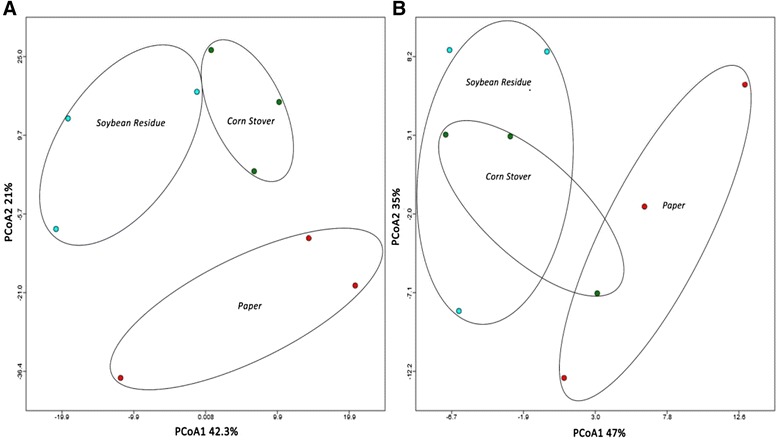
Principal Coordinate Analysis of reads from the guts of Reticulitermes flavipes workers fed for 7-days on paper, Corn Stover or Soybean Residue. Reads were compared to (A) Subsystems for genera abundance or (B) KO for functional abundance using a maximum e-value of 1e-5 and a minimum identity of 60%. The data were normalized to values between 0 and 1. Bay-Curtis distance measures were used for genera abundance and Euclidean distance measures used for functional abundance.