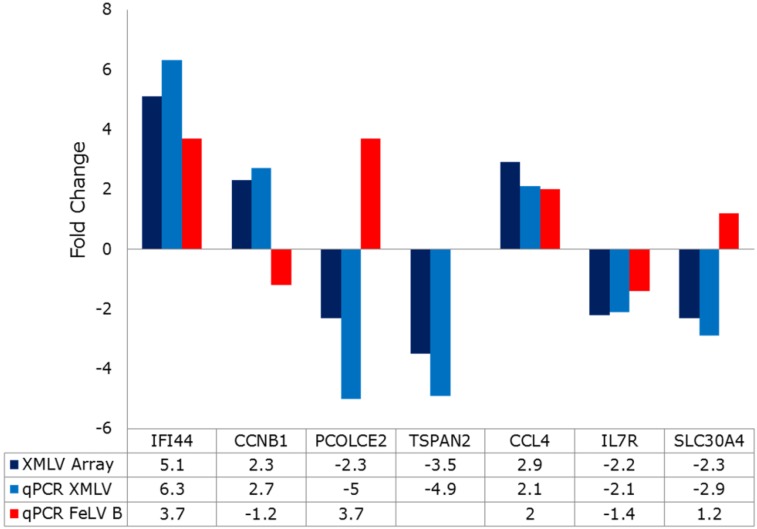
Figure 5.
Validation of significant gene expression changes in XMLV-infected Raji cells by quantitative RT-PCR. Fold changes measured by the microarray shown in Figure 4 (dark blue bars) were validated by qtRT-PCR (light blue bars) and the same genes compared in FeLV-B infected Raji cells (red bars). Fold changes are also listed in the table below. Note that all microarray changes were validated, while only a subset of genes are similarly regulated in FeLV-B-infected Raji cells. NA: not analysed.

