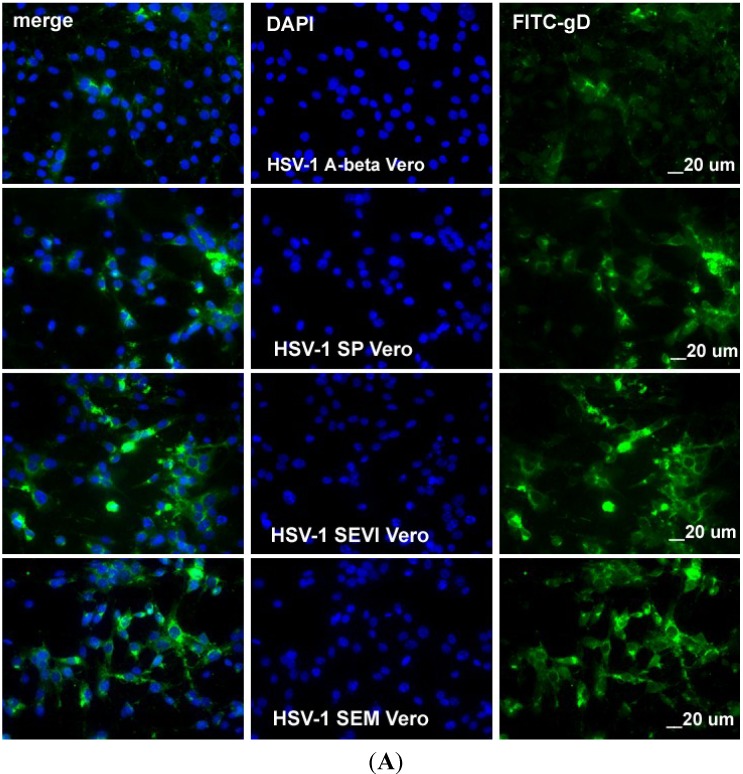
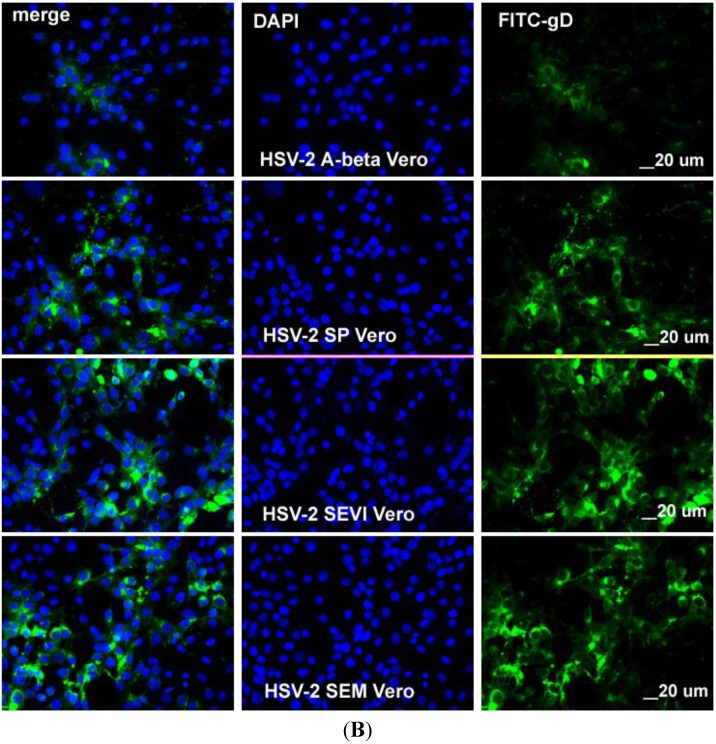
Figure 4.
(A) Visualization of HSV-1 infection in Vero cells. The Vero cells were infected with HSV-1 at an MOI of 0.5 for 8 h following pre-treatment with either 10 μg/mL of A-beta (first row), 1:1000 SP (second row), SEVI (third row), or 10 μg/mL of SEM (fourth row) amyloids. The cells were fixed with 1% paraformaldehyde and stained with anti-gD-FITC in green and DAPI. The slides were observed under a fluorescence microscope (10× amplification lens), and pictures were taken to show infected cells (green) and total cells (DAPI). All scale bars correspond to 20 μm. The imaging experiments were performed three independent times, and the results as shown are representative of one of three experiments; (B) Visualization of HSV-2 infection in Vero cells. Similar to what was done for Figure 4A, except that the Vero cells were infected with HSV-2.


