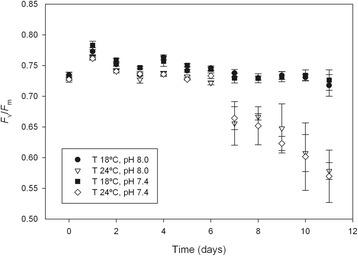
Figure 3.

Microphytobenthos F v / F m under control and elevated CO 2 and temperature. Changes in maximum efficiency of photosystem (PS) II (F v/F m, mean ± standard error, n = 4) of an intertidal sediment during an 11-day period under different temperatures and pH. T 18°C, pH 8.0: Temperature = 18°C, pH = 8.0; T 24°C, pH 8.0.Temperature = 24°C, pH = 8.0; T 18°C, pH 7.4.Temperature = 18°C, pH = 7.4; T 24°C, pH 7.4: Temperature = 24°C, pH = 7.4.
