
Figure 2.
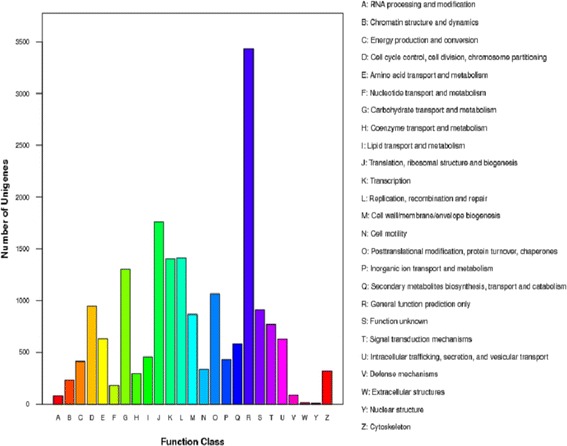
Histogram presentation of Cluster of Orthologus Groups (COG) classification of 7,856 known protein annotated unigenes. Each bar represents the number of unigenes classified into each of the 25 COG functional categories.
Official websites use .gov
A
.gov website belongs to an official
government organization in the United States.
Secure .gov websites use HTTPS
A lock (
) or https:// means you've safely
connected to the .gov website. Share sensitive
information only on official, secure websites.
Histogram presentation of Cluster of Orthologus Groups (COG) classification of 7,856 known protein annotated unigenes. Each bar represents the number of unigenes classified into each of the 25 COG functional categories.