
Figure 5.
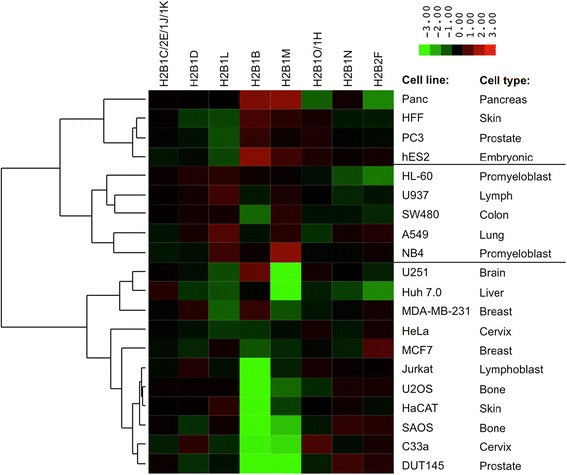
Hierarchical clustering of H2B isoform abundances across 20 cell lines. The relative abundances of H2B isoforms were determined using bottom-up MS, normalized against the average abundance for each isoform across all cell lines and log2 transformed. Data for H2B3B was excluded from the analysis because the characteristic H2B3B peptide (EVQTAVR) was missing from many MS runs due to poor chromatography at the beginning of the LC-MS gradient. The remaining H2B isoforms were quantified for each cell line based on the H2B(1–29) tail sequence and had CV < 30%, n = 3 or 4.