
Figure 8.
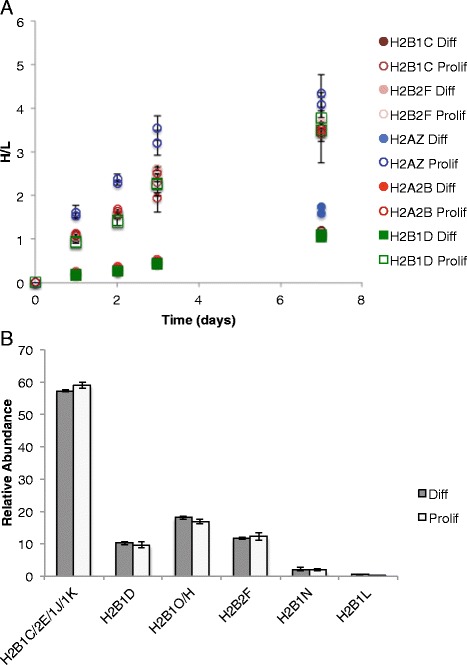
Histone H2B variant levels in myoblast cells compared to myotube cells. (A) Proliferating myoblast (prolif) and differentiated myotube cells (diff) were cultured in media containing heavy arginine, and samples were collected over the course of 7 days to monitor new histone synthesis. Heavy (new) over light (old) levels for histone variants in proliferating or differentiated cells were plotted over time for two biological replicates. (B) Relative abundances of histone H2B variants in myotubes (diff) versus (myoblasts). The abundance of each variant was summed and divided by the abundance of all of the variants. Mean ± SE, n = 3.