
Figure 6.
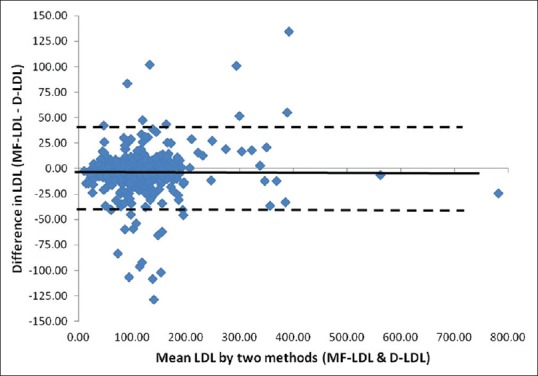
Bland–Altman plot for low-density lipoprotein cholesterol estimated directly and by modified Friedewald's calculation. Mean: −4.02 (negative bias), standard deviation (SD): 21.46; mean +2 SD: +38.90; mean −2 SD: −46.94
Official websites use .gov
A
.gov website belongs to an official
government organization in the United States.
Secure .gov websites use HTTPS
A lock (
) or https:// means you've safely
connected to the .gov website. Share sensitive
information only on official, secure websites.
Bland–Altman plot for low-density lipoprotein cholesterol estimated directly and by modified Friedewald's calculation. Mean: −4.02 (negative bias), standard deviation (SD): 21.46; mean +2 SD: +38.90; mean −2 SD: −46.94