
Figure 1.
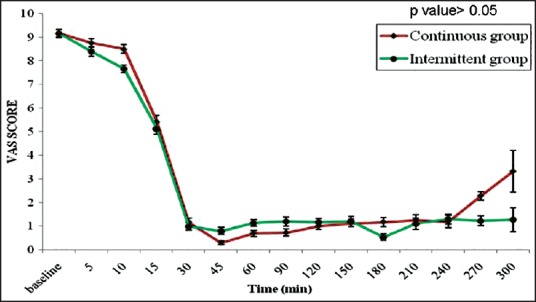
Median visual analog scale score. The figure shows median visual analog scale (VAS) scores against time for the two groups. No significant difference in VAS scores between the two groups at any time during labor (P > 0.05)
Official websites use .gov
A
.gov website belongs to an official
government organization in the United States.
Secure .gov websites use HTTPS
A lock (
) or https:// means you've safely
connected to the .gov website. Share sensitive
information only on official, secure websites.
Median visual analog scale score. The figure shows median visual analog scale (VAS) scores against time for the two groups. No significant difference in VAS scores between the two groups at any time during labor (P > 0.05)