
Figure 4. DRN Pet-1 neurons are activated in response to rewarding stimuli in an olfactory Go/No-go task.
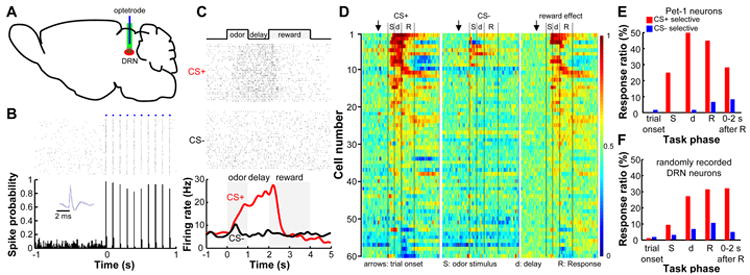
(A) DRN neurons were recorded from behaving mice with optetrodes. (B) Raster plot (upper) and peristimulus time histogram (PSTH; lower, bin width = 10 ms) show that light stimulation reliably evoked spike firing of a DRN neuron. The inset shows that light-evoked (blue) and spontaneous (black) spikes had similar waveforms. (C) Raster plot and PSTH (smoothed with a Gaussian kernel, σ=100 ms) of the activity of a DRN Pet-1 neuron aligned to odor onset. (D) Population activity of DRN Pet-1 neurons in the Go/No-go task. Each row represents the activity of a single neuron. For CS+ and CS- trials (left and middle panels), firing rates were compared with the mean rates before trial onset (arrows) to calculate receiver operating characteristic (ROC) values and are represented with colors. AUC, the area under a ROC curve. An AUC value of 0.5 indicates no difference from the mean activity before trial onset. Reward effect (right panel) was computed by comparing the firing rates of CS+ and CS- trials of the same neurons and an AUC value of 0.5 indicates no selectivity. (E) Distribution of identified DRN Pet-1 neurons with significant selective responses to CS+ or CS- within different phases of Go/No-go tasks. (F) Distribution of response selectivity for the 159 randomly recorded DRN neurons without cell-type identification. See also Figure S4.