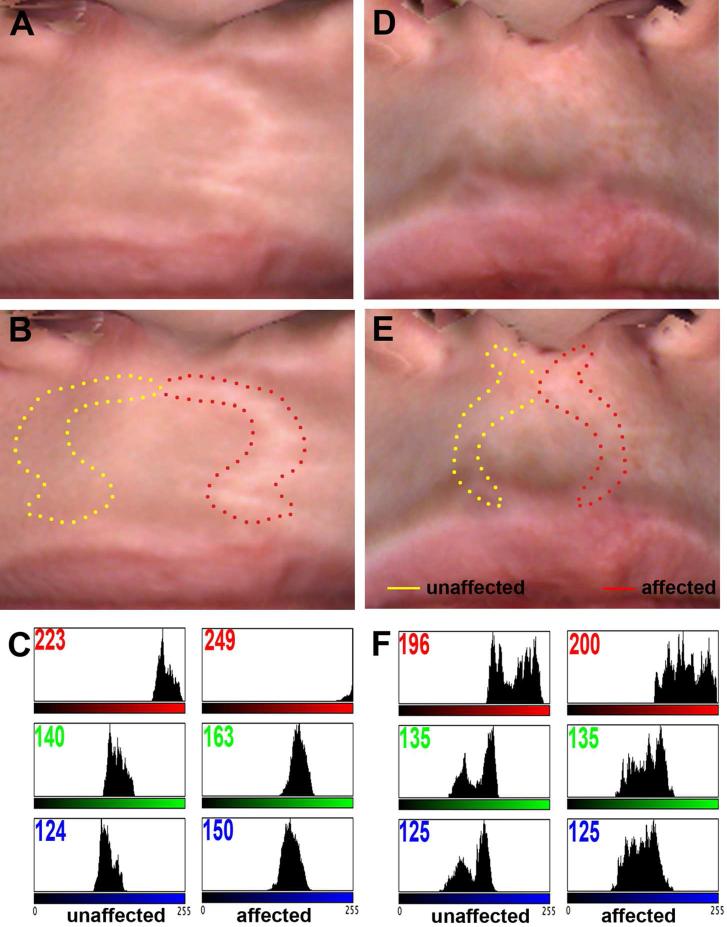
Figure 2.
Digital image analysis of scar after cleft lip surgical repair. Digital macrophotographs of two patients with poor (A) and excellent (D) healing outcome. The affected (dotted red lines) and unaffected (dotted yellow lines) contralateral areas were traced for each patient (B, E). Color histograms of each area were generated using ImageJ software (C, F). The number in the top left corner of each profile corresponds to the mean color value. Note the difference in intensity in the three red, green and blue color components between unaffected and affected area in the poor healer (C), compared to the absence of difference in the good healer (F).

