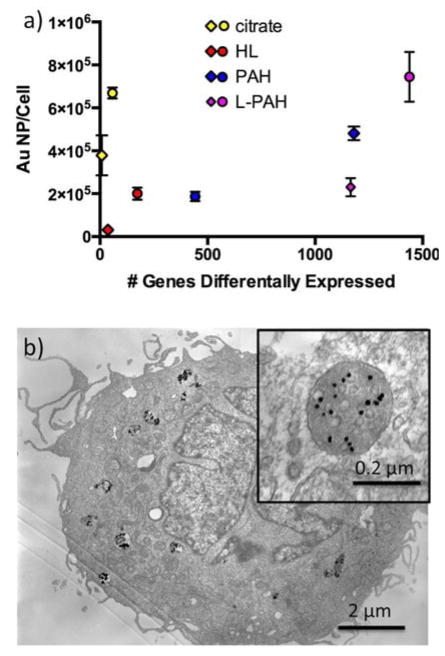
Fig. 5.
a) Au NP total uptake per cell quantified by ICP-MS for PC3 (circles) and HDF (diamonds) cells versus number of genes differently expressed for each type of Au NP-exposed samples. PC3 cells were incubated with Au NPs at 1.0 nM and HDF cells with Au NPs at 0.1 nM overnight. b) Transmission electron microscopy of HL Au NPs in PC3 cells at 1.0 nM. Inset shows HL Au NPs in a vesicle at higher magnification.

