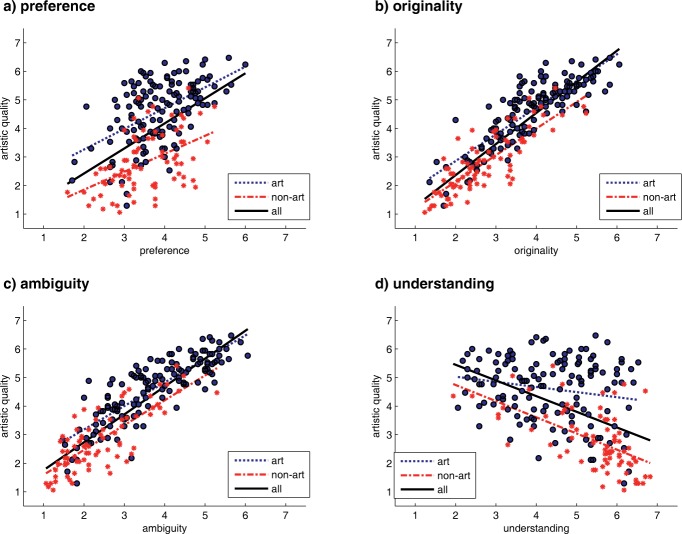
Figure 1.
Bivariate diagrams showing the relationship between the dimensions artistic quality and (a) preference, (b) originality, (c) ambiguity, (d) understanding, split by the categories of art (blue solid dots) and non-art objects (red asterisks). Dotted lines indicate linear fits for each category separately; solid lines show the overall linear fits when taking both categories together.

