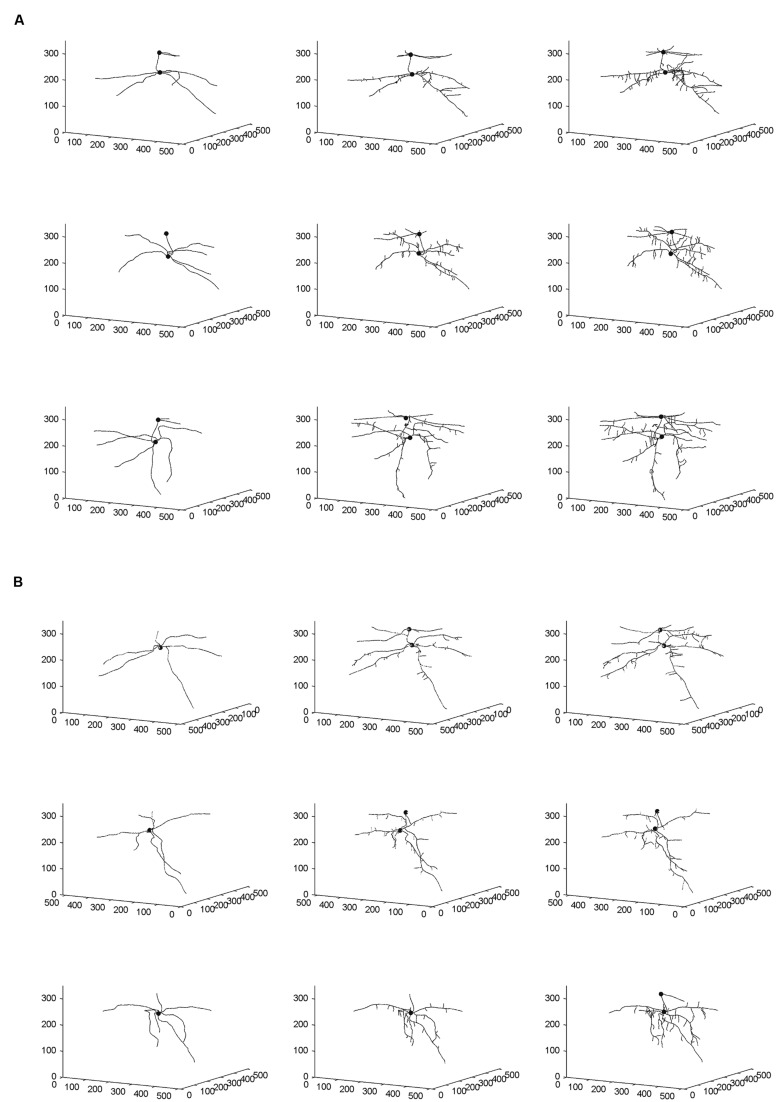
FIGURE 2.
Skeletal 3-D images of corn root systems for (A) optimal and (B) salt-stress treatments, as constructed from computed tomography (CT) scanning data collected on a weekly basis over 3 weeks (i.e., Weeks 1–3 from left to right) for the three individual plants in each treatment group. In each panel, the horizontal plane in the 3-D rendering represents the X-Y plane in CT scanning terminology; this plane is perpendicular to the couch of the CT scanner. The small filled spheres locate the connection points of the primary upper and lower roots to the below-ground part of the stem.

