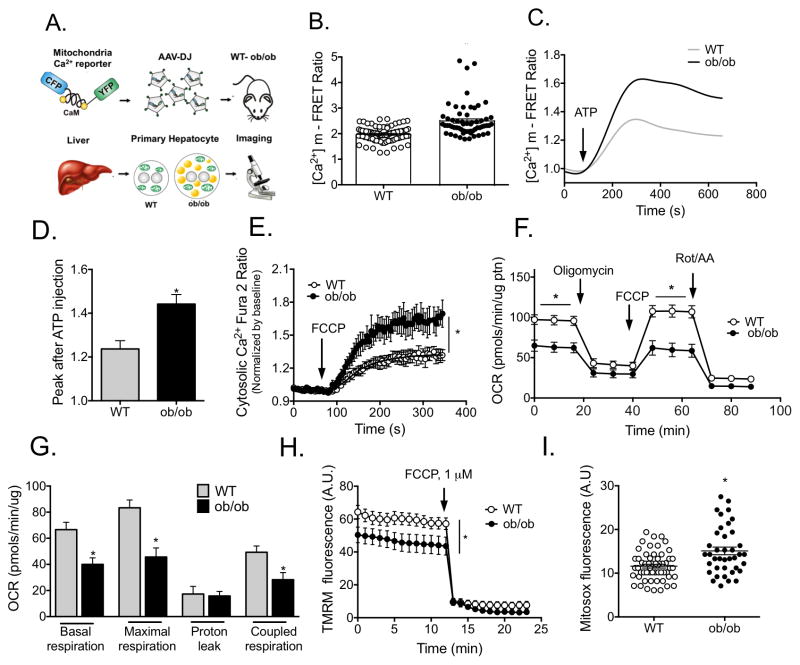
Figure 4. Obesity alters mitochondrial calcium flux liver.
(A) Schematic depicting the details of the experimental procedure used to measure mitochondrial Ca2+ levels in primary hepatocytes. (B) Mitochondrial Ca2+ content in primary hepatocytes from wt and ob/ob mice measured by FRET of 4mtD3cpv, n= 81 (wt) or 60 (ob/ob) cells, 4 independent experiments. (C) Representative trace of [Ca2+]m upon 100uM ATP stimulation. (D) Quantification of the Ca2+ peak after ATP stimulation, n=15 cells, 4 independent experiments. (E) Cytosolic Ca2+ measured with 4μM of Fura 2-AM after 1μM FCCP treatment, n=60 (wt) or 40 (ob/ob) cells, 3 independent experiments. (F–G) Oxygen consumption rate (OCR) of primary hepatocytes from lean and ob/ob mice in basal assay medium (basal respiration), in the presence of 2μM olygomicin, (ATPsynthase inhibitor), 1μM FCCP (uncoupling agent) and 2μM Rotenone (Rot) and 2μM antimycin (AA) (complex I and III inhibitors, respectively). Maximal respiration, proton leak and coupled respiration were determined as described in methods section, n=11 (wt) n=13 (ob/ob) plates, 7 independent preparations. (H) Mitochondrial membrane potential in isolated hepatocytes from wild type and ob/ob mice, n=23 (Wt), n=15 (ob/ob), representative of 3 independent experiments (I) ROS production measured with 3μM mitosox loading. n=57 (wt) and 39 (ob/ob) cells from 3 independent experiments. All the graphs represent mean ± SEM, *P < 0.05, Student’s t-test.

