
Figure 12.
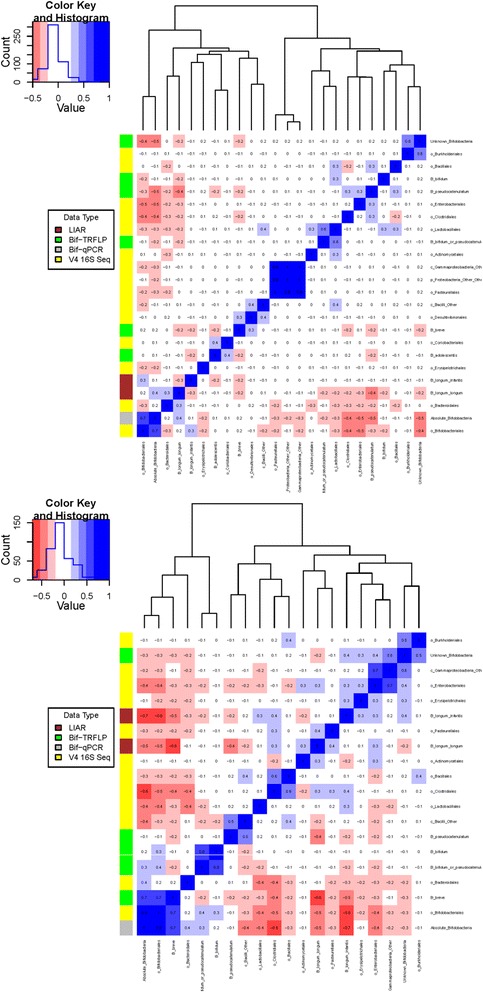
Pearson correlation matrices. Correlating the results of Bif-TRFLP (bifidobacteria-specific terminal restriction fragment length polymorphism), qPCR, V4 16S amplicon sequencing, and BLIR (Bifidobacterium longum/infantis ratio) in non-secretor-fed (bottom) and secretor-fed (top) infants. The number in each box is the Pearson correlation coefficient. The colored bar on the left side of the matrix indicates what type of data the row is. Negative correlations are colored in shades of red and positive correlations are shown in shades of blue.