
Figure 14.
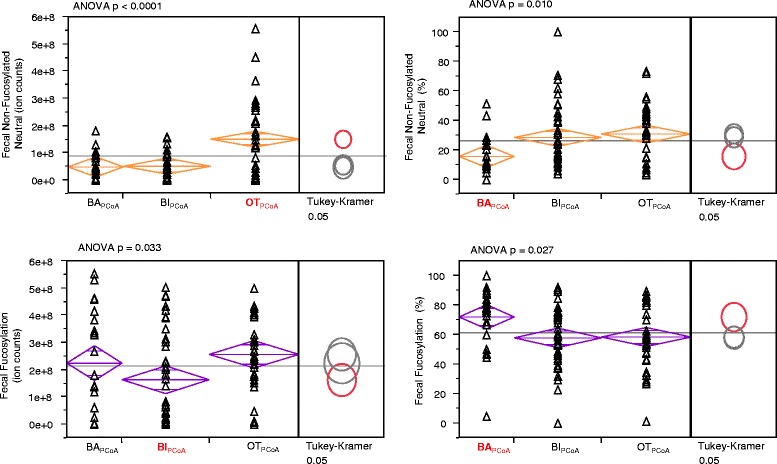
Differences in the amount of fecal HMOs in infants of each PCoA group. Differences in the amount of each HMO class remaining in the feces of samples that fell into each of the three main PCoA categories BAPCoA = Bacteroides, BIPCoA = Bifidobacterium, OTPCoA = other taxa.