
Figure 8.
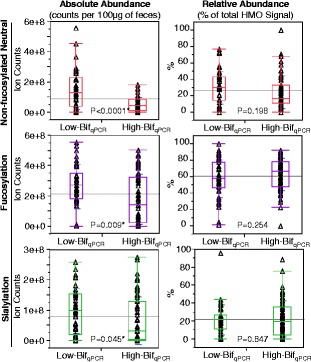
Differences in fecal HMOs between samples that were either High-Bif qPCR or Low-Bif qPCR . The p values are from a two-tailed unpaired t-test. * = Significant at 95% confidence level. HMO = human milk oligosaccharide.
Official websites use .gov
A
.gov website belongs to an official
government organization in the United States.
Secure .gov websites use HTTPS
A lock (
) or https:// means you've safely
connected to the .gov website. Share sensitive
information only on official, secure websites.
Differences in fecal HMOs between samples that were either High-Bif qPCR or Low-Bif qPCR . The p values are from a two-tailed unpaired t-test. * = Significant at 95% confidence level. HMO = human milk oligosaccharide.