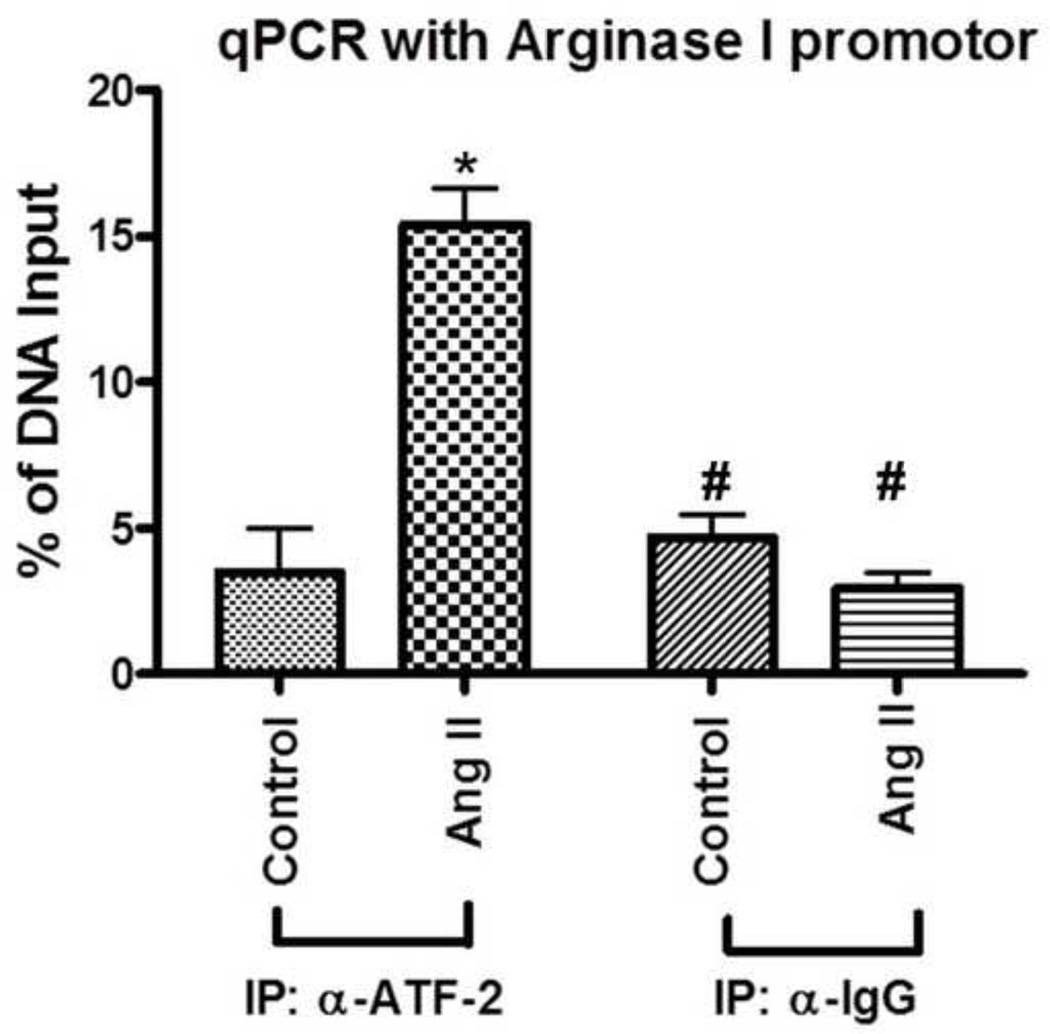
Fig 8. ChIP assay determines ATF-2 association with the arginase 1 promoter.
ChIP assays were performed in BAECs treated with Ang II versus untreated control. anti-ATF-2 antibody and arginase 1 PCR primer were used. IgG (5 µg/IP) was used as negative IP control. qPCR was performed with primers for the 18S promoter and for bovine arginase 1 gene. qPCR analysis was performed using delta-delta circle time (Ct). Fig. shows percentage of DNA input (relative amount of immunoprecipitated DNA compared to input DNA after qPCR analysis normalized to the internal control 18S). IP; Immunoprecipation, α-ATF-2; anti-ATF-2. n=3 of independent experiments. *P<0.05 vs. control, #P<0.05 vs. Ang II IP: α-ATF-2.

