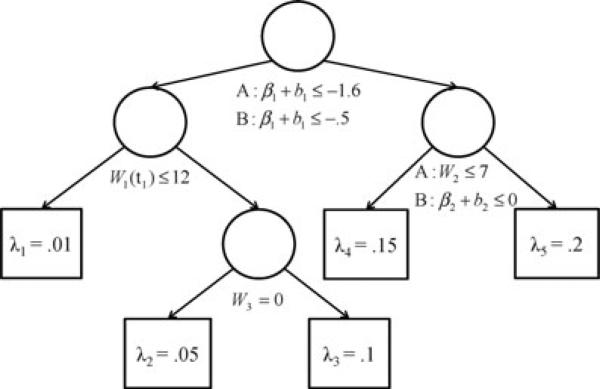
Figure 2.
True survival tree models for scenarios A (linear temporal feature only) and B (linear and quadratic temporal features). In scenario A, the tree splits first on the slope, β1 + b1, followed by the observed baseline value of the repeatedly measured covariate, W1 (t1), and fixed-time covariates W2 and W3. In scenario B, the tree splits first on the slope, followed by splits on the baseline value of the repeatedly measured covariate, the curvature, β2 + b2, and fixed-time covariate W3. Time-to-event outcomes of cases classified into each of the five terminal nodes follow exponential distributions with parameters λh, h = 1, . . . , 5.

