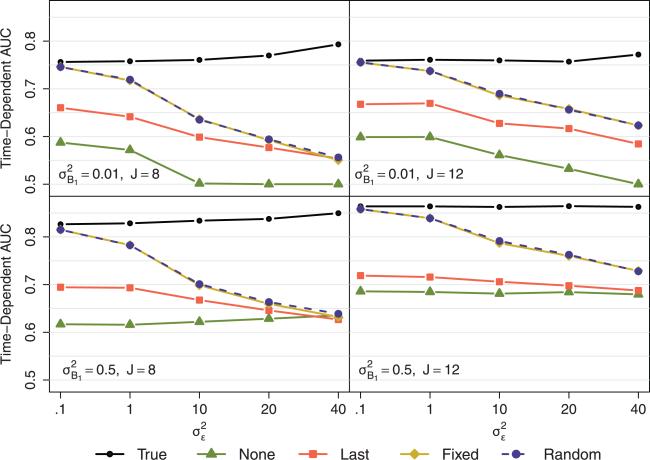
Figure 4.
Scenario B: Quadratic temporal feature. Plotted values represent the median time-dependent AUC for 1000 simulations of training and testing samples of N = 500 each. The top and bottom rows display results from data generation scenarios with smaller and larger between-subject variability, respectively. The first and second columns display results from data generation scenarios with 8 and 12 repeatedly measured covariates, respectively. Within each line graph, the five different methods are compared across data generation scenarios ranging from small to large within-subject variability.

