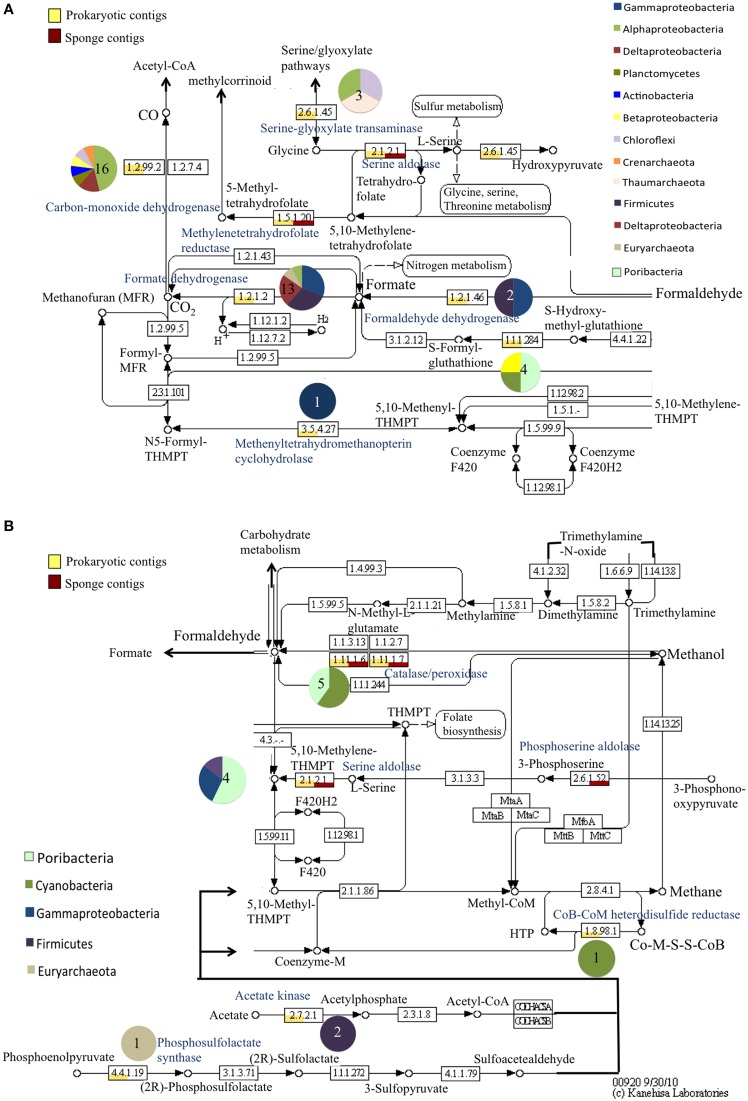
Figure 4.
Relative abundance of prokaryotic and sponge transcripts involved in methane metabolism. MEGAN was used to visualize transcripts on the KEGG map. The map was separated into pathways centered on carbon monoxide and formate reactions (A) and methane reactions (B) for visualization. Pie charts near each enzyme number indicate the phyla represented by the transcripts and the number in the pie chart is the number of transcripts. Enzyme names are provided in blue. For clarity not all intermediates are shown.

