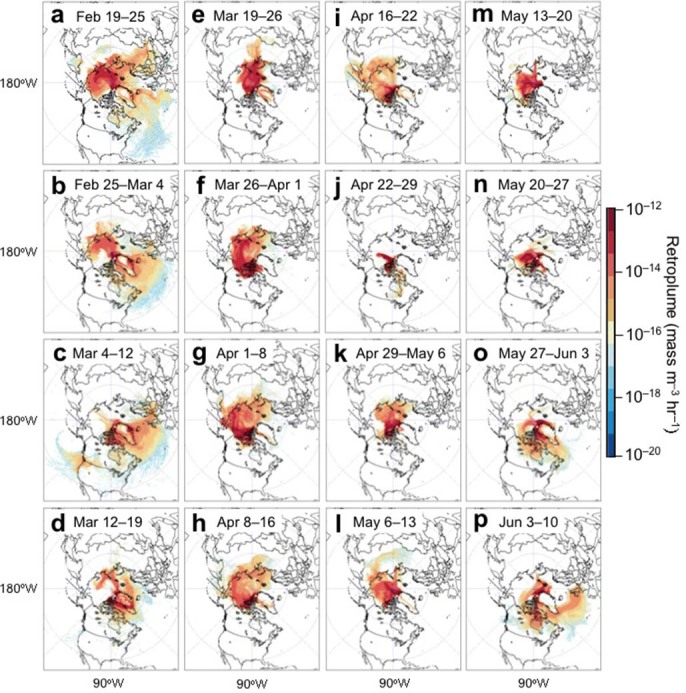
Figure 3. Averaged retroplumes (“footprint” residence time) showing the transport pathways of air masses observed at Alert (shown as a white circle on each map).

The sampling period for each sample was about one week. The maps were drawn by the software of Igor Pro, http://www.wavemetrics.com/.
