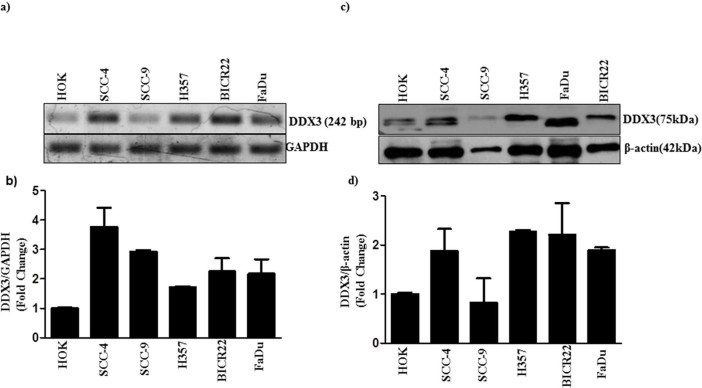
Figure 2. DDX3 expression in human OSCC: a) Total RNA was isolated from indicated cells and RT-PCR was performed to analyze the expression of DDX3 as described in materials and methods.
b) The Bar graph indicates the ratio of DDX3 to GAPDH band intensity. SD (n = 3). c) Cell lysates were collected from the indicated cells, and expression of DDX3 was determined by Western blotting. d) The Bar graph indicates the ratio of DDX3 to β-actin band intensity. SD (n = 3).

