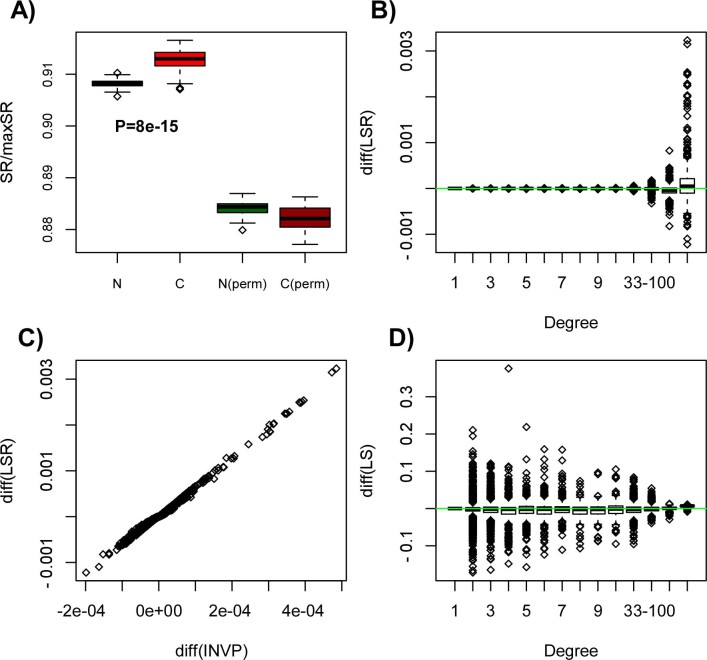
Figure 1. Increased entropy in liver cancer is driven by increased entropy at hubs:
(A) Boxplots comparing the entropy rate (SR) of 50 normal liver samples (N) to 50 matched liver cancer specimens (C), derived from RNA-Seq data of the TCGA consortium. P-value is from a one-tailed Wilcoxon rank sum test, testing the hypothesis that entropy rate is higher in cancer. Also shown is the SR between normal and liver cancer for a case where the gene expression profiles were randomly permuted (perm) over the interaction network. Observe how the difference in the SR between normal and cancer is reduced and even takes an opposite directionality, demonstrating that the interplay between gene expression changes and network topology is dictating the higher signaling entropy in cancer. (B) Boxplots showing the change in the mean local entropy rate (LSR) (〈πiLSi〉C − 〈πiLSi〉N) between normal and cancer of each node (gene) as a function of node degree, positive values indicating higher values in cancer. (C) Scatterplot of the differential change in the mean local entropy rate against the differential change in the mean invariant measure (INVP) (〈πi〉C − 〈πi〉N). Each data point is one node (gene). (D) Boxplots showing the change in the mean local entropy (LS) of each node (gene) (〈LSi〉C − 〈LSi〉N) between normal and cancer, as a function of node degree.

