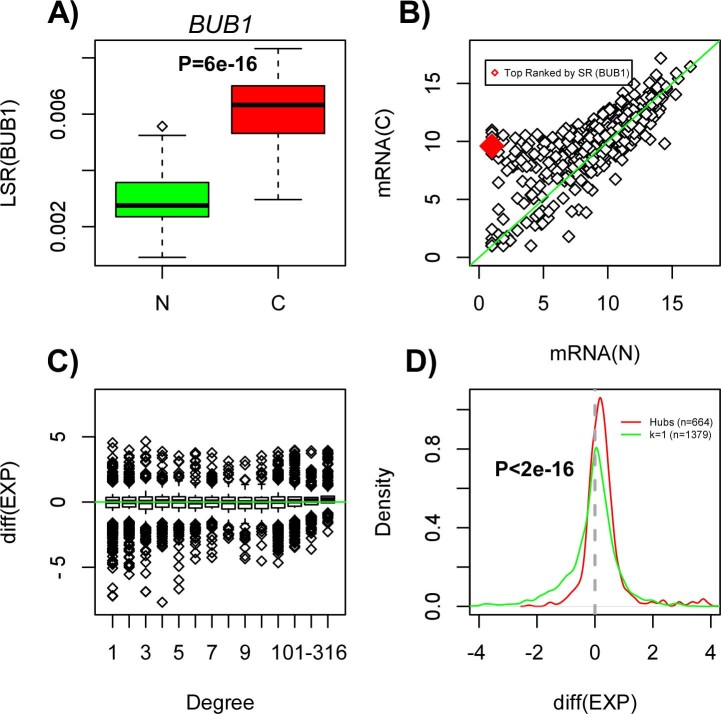
Figure 2. Preferential overexpression of hub genes in cancer:
(A) Boxplot showing the local entropy rate (LSR) against normal/cancer status, for the hub gene (BUB1) exhibiting the largest increase in the local entropy rate. P-value is from a Wilcoxon rank sum test. (B) Scatterplot of gene expression values between a representative normal (x-axis) and cancer (y-axis) sample for the gene showing the largest increase in the local entropy rate (gene BUB1, marked in red) and that of its neighbours in the PPI network (over 800 neighbours, shown in black). (C) Boxplot of the average difference in gene expression between normal and cancer (positive values indicate higher expression in cancer) against node-degree class. Observe how the highest-degree hubs show preferential increased expression in cancer, whereas the largest reductions in expression target low-degree nodes. (D) Density plot of the average difference in gene expression between normal and cancer for two classes of genes: hubs (defined as nodes of degree >316) and nodes of degree 1 (k = 1). The number of each is indicated, and the P-value is from a Kolmogorov-Smirnov test, testing for a difference in their statistical distributions.

