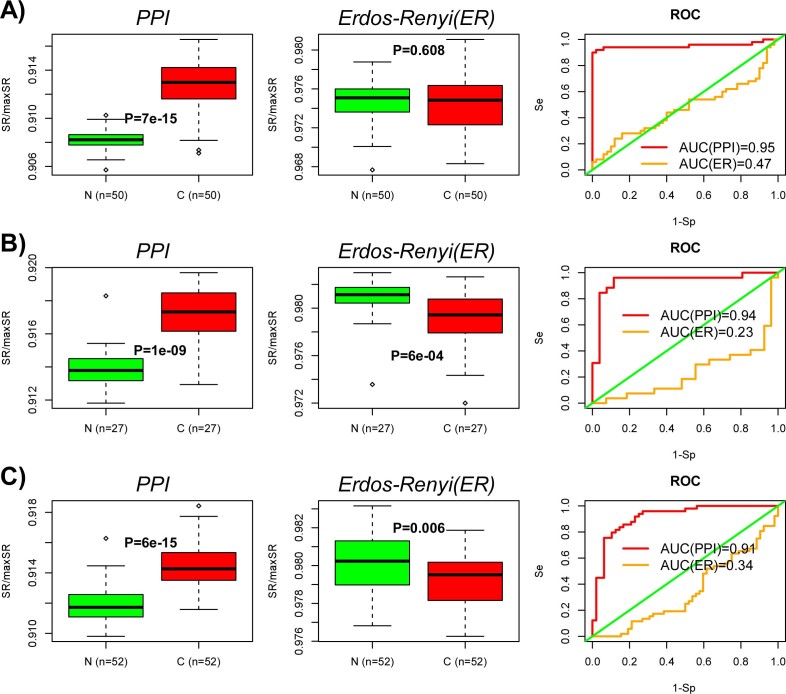
Figure 5. Entropy rate increase in cancer requires the scale-free topology of the PPI network:
(A) Boxplots of the entropy rate (SR) for the 50 normal liver and 50 liver cancer samples as evaluated on the original full PPI network (left), as well as on an equivalent Erdos-Renyi graph (middle). P-values are from a Wilcoxon-rank sum test. Corresponding ROC curves and AUC values (right). (B) As A) but for TCGA RNA-Seq data from 27 colon cancers and 27 matched normals. (C) As A) but for TCGA RNA-Seq data from 52 prostate cancers and 52 matched normals.

